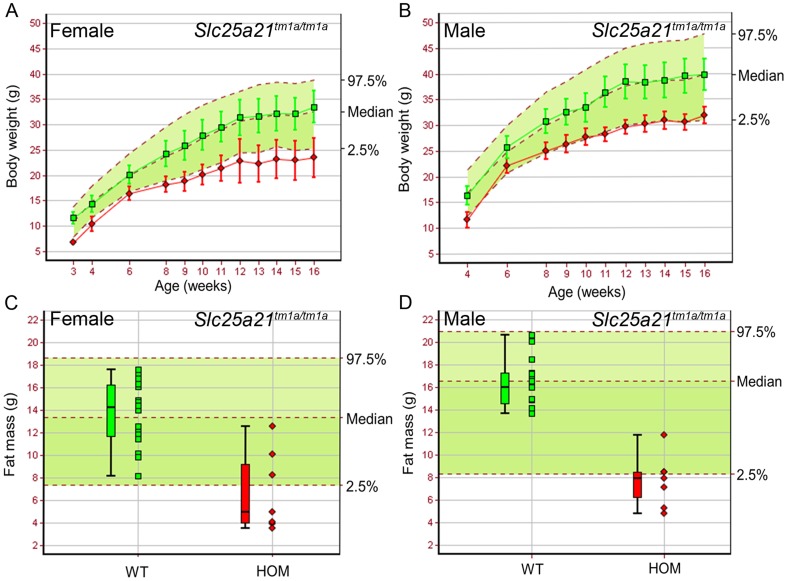
Figure 1. Body weight and fat mass were reduced in homozygous Slc25a21tm1a(KOMP)Wtsi mice.
Homozygous (red symbols) Slc25a21tm1a(KOMP)Wtsi female (A,C) (n = 7) and male (B,D) (n = 7) mice showed decreased body weight and fat mass compared to local wild-type controls run on the same week (green symbols) (female, n = 22; male, n = 15). Mean (± SD) body weight is plotted against age (A,B). Fat mass is presented as a boxplot, with median, 25th and 75th percentile (box), and the lowest and highest data point within 1.5× inter quartile range (whiskers) shown (C,D). The median and 95% reference range (2.5–97.5th percentiles, dotted lines) for all wild-type mice of the same genetic background and sex (n>750) are displayed on the pale green background.

