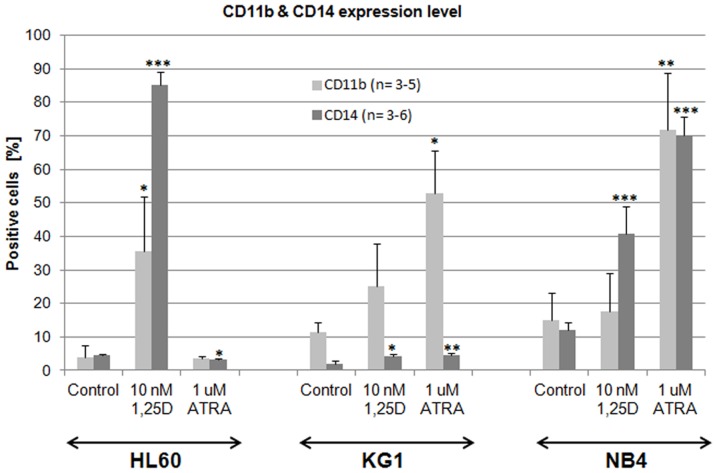
Figure 1. Differentiation of HL60, KG1 and NB4 cells in response to 1,25D and ATRA.
The cells were exposed to 1,25D (10 nM) or to ATRA (1 μM) for 96 h and then the expression of differentiation markers CD11b and CD14 was detected using flow cytometry. Mean values (±SEM) of percentages of positive cells are presented in Y-axis. Results that differ significantly from the result for respective control cells are marked with asterisks (*p<0.05; **p<0.01; ***p<0.001).

