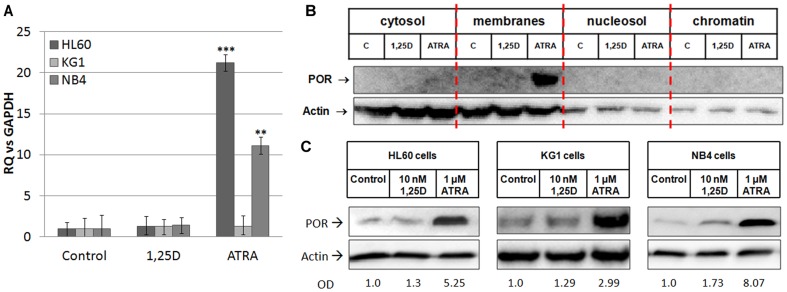
Figure 2. Regulation of POR gene and protein by 1,25D and ATRA in AML cells.
The cells were exposed to either 1,25D (10 nM) or ATRA (1 μM) and (A) after 96 h the expression of POR mRNA was tested in Real Time PCR. The bar charts show mean values (±SEM) of fold changes in POR mRNA levels relative to GAPDH mRNA levels. The control samples were calculated as 1. Results that differ significantly from the result for respective control cells are marked with asterisks (**p<0.01; ***p<0.001). The expression of POR protein was detected using Western blot in (B) HL60 cells divided into cytosol, membranes, nucleosol and chromatin or (C) in mitochondria of HL60, KG1 and NB4 cells. The proteins were analyzed using anti-POR and anti-actin antibodies. In case of mitochondrial lysates the optical densities (OD) of POR bands divided by ODs of respective actin bands were calculated from 3 blots and the mean values are given below the blots.

