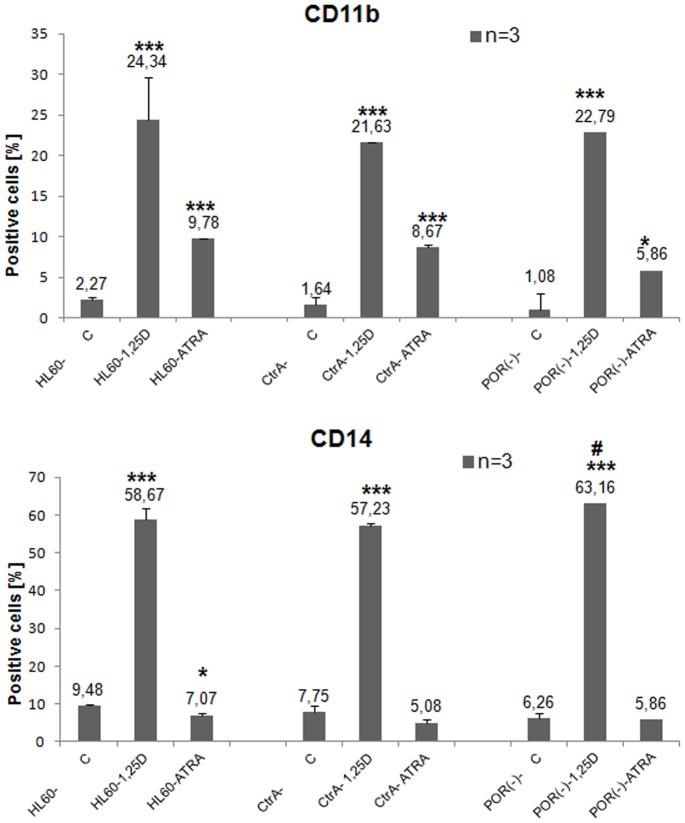
Figure 4. Differentiation of transfected HL60 cells exposed to 1,25D or ATRA.
HL60 cells were transfected with plasmids containing either control shRNA (CtrA) or POR shRNA and then were exposed to either 1,25D (10 nM) or ATRA (1 μM) for 96 h. The expression of differentiation markers CD11b (upper graph) and CD14 (bottom graph) was detected using flow cytometry. Mean values (±SEM) of percentages of positive cells are presented in Y-axis. Results that differ significantly from the result for respective control cells are marked with asterisks (*p<0.05; ***p<0.001), while the sample which differs from the appropriate CtrA sample is marked with hash (#p<0.05).

