
Figure 1. Expression of preproPACAP and PACAP receptors in chondrifying micromass cultures.
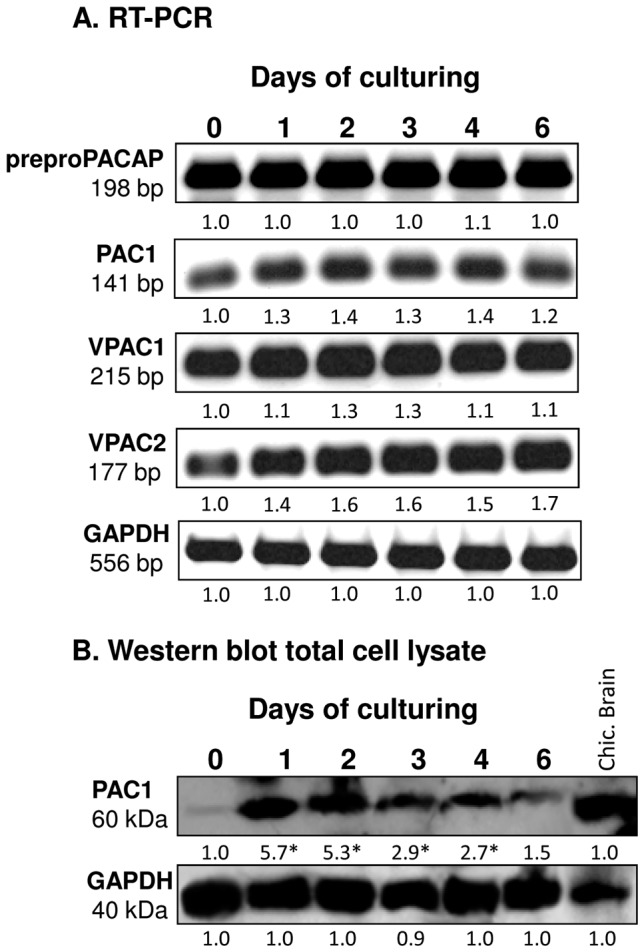
For RT-PCR (A) and Western blot (B) reactions, GAPDH was used as control. Optical density of signals was measured and results were normalised to the optical density of 0-day-old cultures. Representative data of 3 independent experiments. For panels (A) and (B), numbers below signals represent integrated densities of signals determined by ImageJ software.