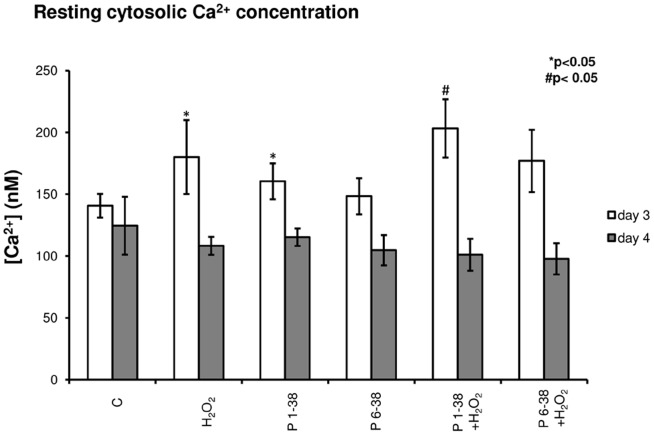
Figure 4. Administration of PACAPs and/or H2O2 influences Ca2+ homeostasis of chondrogenic cells.
PACAP 1-38 at 100 nM, PACAP 6-38 at 10 µM were administrated continuously from day 1. Basal cytosolic Ca2+ concentration in Fura-2-loaded cells of HDC on days 3 and 4 of culturing. Measurements were carried out in untreated control cultures, during PACAP treatment or directly after oxidative stress. Data shown are mean values of 30 cells in each experimental group. Asterisks indicate significant (*P<0.05) alterations of cytosolic Ca2+ concentration as compared to the respective control; hash signs indicate significant (# P<0.05) difference in cytosolic Ca2+ concentration as compared to the respective H2O2 treatment. Shown are representative results of 3 independent experiments. (C, control; P1-38, PACAP 1-38; P6-38, PACAP 6-38).

