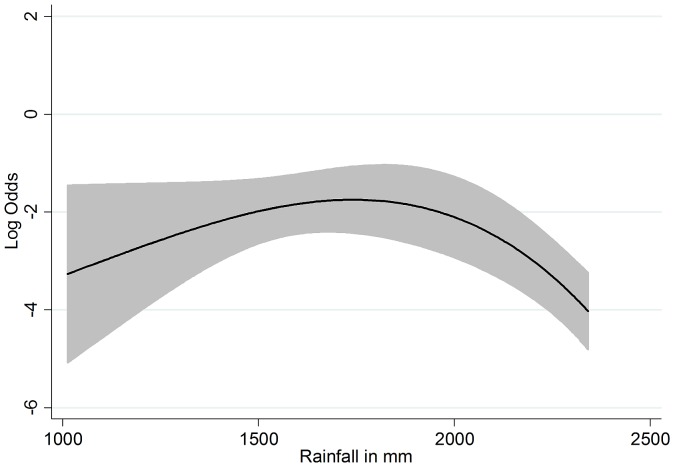
Figure 4. Non-linear partial prediction of the log odds of A. lumbricoides infection by annual rainfall.
The partial predicted curve is adjusted for LST-day, slope, SES, age, latrine coverage and the nine study sites. The maximum is at 1740 mm of mean annual rainfall. Grey shadings indicate 95% confidence band.

