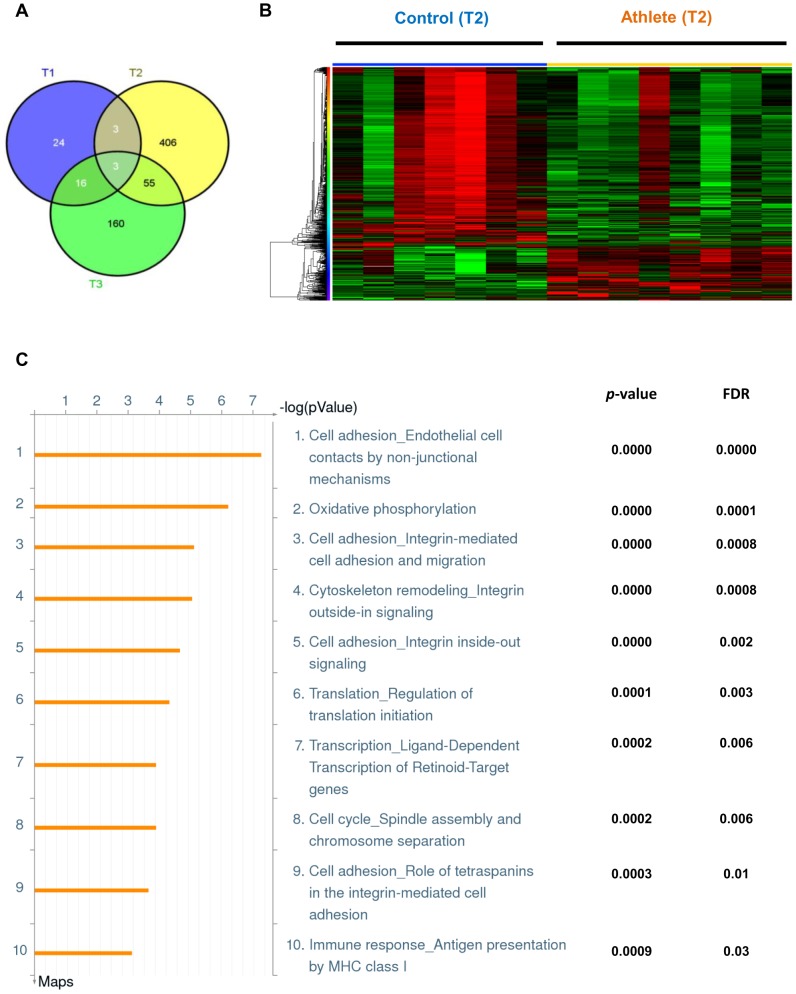
Figure 2. Differential gene expression between control and athlete subjects after exercise.
(A) Venn diagram representing genes differentially expressed between control and athlete groups at time points T1 (blue; 24 hrs before exercise; n = 4 for each group); T2 (yellow; immediately after exercise; n = 7 for controls and n = 8 for athlete group); and T3 (green; 24 hrs after exercise; n = 4 for each group). Fold change>1.5; False Discovery Rate (FDR)<0.1. Genes differentially regulated at two or three time points are shown in the corresponding intersecting segments. (B) Heatmap representing genes differentially expressed between individual control and athlete samples at time point T2 (immediately after exercise). Each column represents an individual subject. Red represents an up-regulation, and green a down-regulation in gene expression. Probes and samples are clustered by hierarchical clustering Fold change>1.5; FDR<0.1. (C) Top 10 canonical pathway maps representing genes differentially expressed between athlete and control groups at time-point T2 by Metacore analysis with corresponding p-values and FDR.

