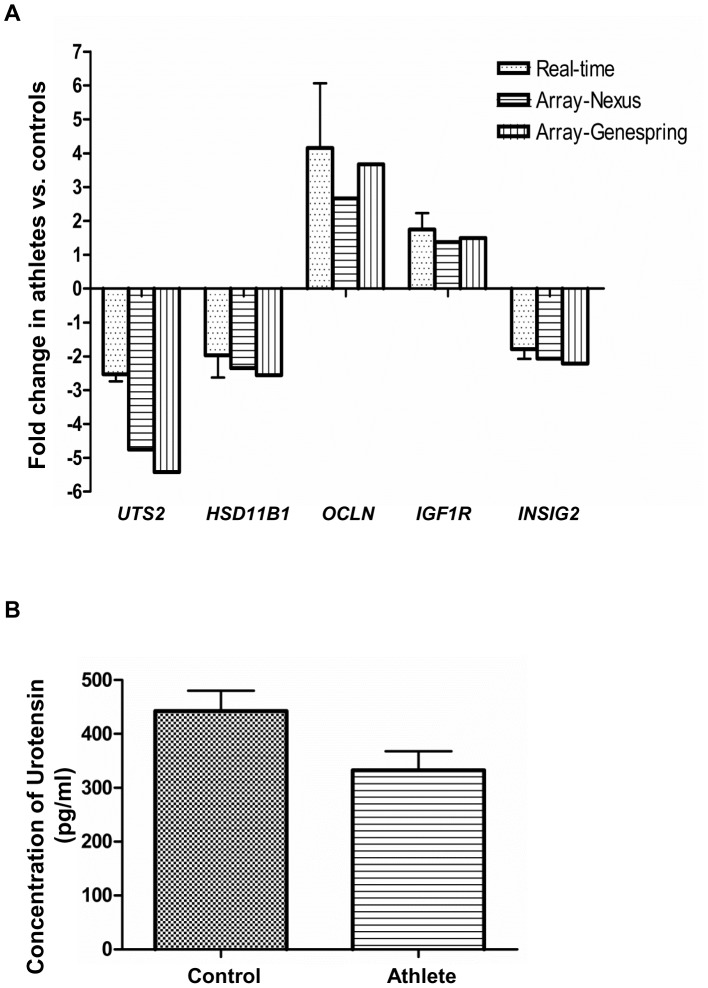
Figure 3. Validation of microarray data.
(A) Fold-change in expression of genes UTS2, HSD11B1, OCLN, IGF1R and INSIG2 between athlete (n = 8) and control (n = 7) groups at time point T2, as evident by microarray analysis (Nexus Gene Expression and Genespring), and validated by quantitative real-time PCR (qRT-PCR). qRT-PCR data are normalized to the housekeeping gene and were statistically significant with p<0.05 (n = 6 in each group). (B) Concentration of urotensin (pg/ml) in the plasma of control (n = 8) and athlete (n = 6) subjects at time-point T1.

