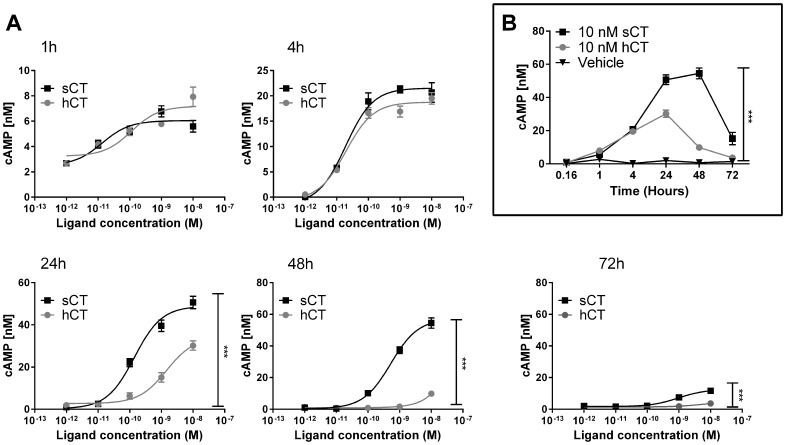
Figure 2. Difference in CT(a)R -mediated cAMP response by prolonged continuous hCT and sCT stimulation.
A) cAMP production as a function of ligand concentration as U2OS CALCR cells were stimulated with sCT or hCT at a dose range of 10 pM to 10 nM for a prolonged period of time, ranging from 1, 4, 24, 48 to 72 hours. Ligands and medium were only added during the initiation of the experiment. Assays were conducted without IBMX in the medium to assess time dependent cAMP production. B) Single dose of 10 nM sCT, 10 nM hCT and Vehicle shown in (A) plotted as a function of time. Asterisk (*) indicate significant difference between AUC sCT and AUC hCT, p<0.05 was considered to be significant. * = p<0.05, ** = p<0.01, *** = p<0.001. Data are shown as mean ± SEM and representative of three individual conducted experiments using five replicates.

