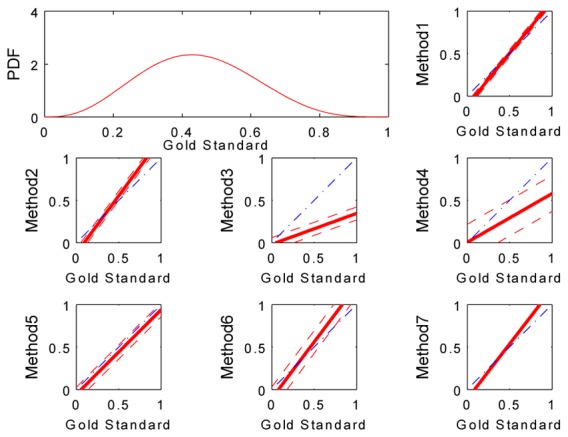
Fig. 2.

Upper left corner: Probability distribution function (PDF) of a beta distribution describing the ejection fractions of the database (μ = 4, ν= 5). The other plots in the figure show estimates of the biomarker for each method (solid red line) with their associated standard deviation (dashed red lines) superimposed on the ideal estimation (dash-dotted blue line).
