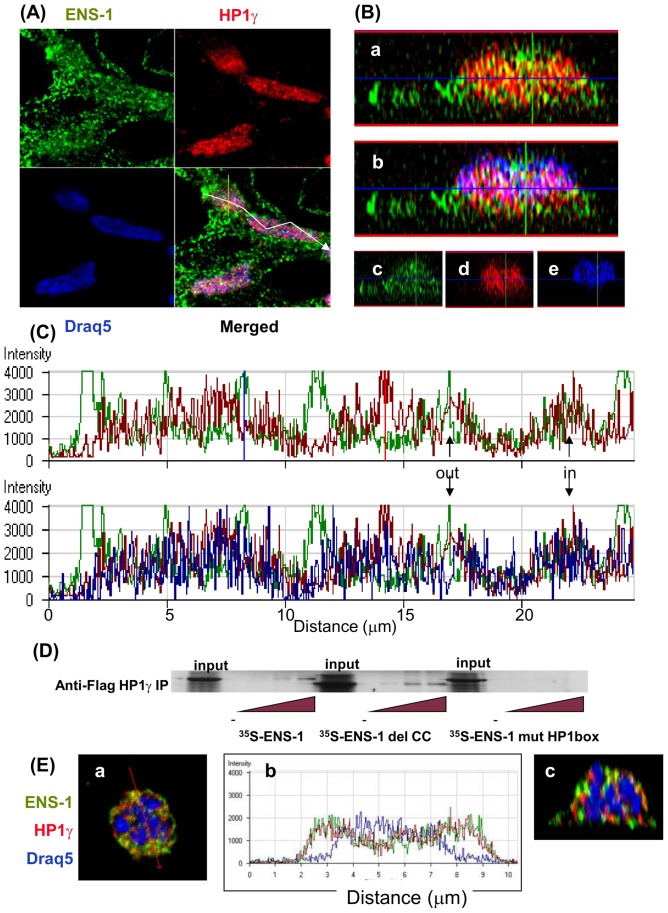
Figure 4. Sparse co-localization of ENS-1 and HP1γ in CES nuclei.
(A) Immunostaining of CES cells was performed simultaneously with the rabbit anti- HP1γ (red) and the mouse anti-ENS-1 antibodies (green) detected using Alexa 555 and Alexa 488 conjugated secondary antibodies respectively. DNA was stained with Draq5 (blue). Observations were performed by confocal microscopy. (B) Distribution of ENS-1 and HP1γ in the thickness of CES. The z-cut axis is reported in (A) with a yellow bar on the merge panel. Distribution of HP1γ and ENS-1 is shown in panel a, co-localization of both proteins gives a yellow spot. In panel b the DNA staining was shown and white spots indicate ENS-1 and HP1γ proteins co-localizing on DNA. Individual distributions of ENS-1, HP1γ and DNA merged in a and b are represented in panels c, d and e respectively. (C) Fluorescence intensity for the three labels along the line represented in (A) by the white arrow. The upper panel represents fluorescence intensities obtained for HP1γ (red) and ENS-1 (green), the intensities obtained for chromatin (blue) have been added to the lower panel. Arrows point out co-localizations of HP1γ and ENS-1 in or out the chromatin. Intensity axis is in arbitrary units. (D) Pull-down experiments of 35S-ENS-1 with Flag-HP1γ. Lysates from COS cells transfected with pCi-flag- HP1γ were used as a source for the flag tagged chicken HP1γ protein. 35S labeled ENS-1 proteins were obtained by in vitro translation from pGBKT7 constructs coding for intact or mutated ENS-1 proteins: del CC indicates deletion of the coiled-coil domain (-50AA, 5.56 kDa), mutHP1 box indicates mutation in the HP1 box. After incubation of COS7 cell lysates with different dilutions of the ENS-1 proteins, HP1γ was precipitated with an anti-flag antibody and the association with 35S-ENS-1 was revealed by fluorography. Representative results of at least three different experiments. (E) Confocal analysis of a CES cell entering in mitosis (prometaphase) from the same experiment as in A. In panel a, merge representation of the labeling for ENS-1, HP1γ and DNA as in A. In panel (b), fluorescence intensity along the line represented in panel (a) by the red arrow for the three markers labeled. The panel (c) is a z-cut representation of the same cell.

