
Figure 3. Gating motions in the outward- and inward-facing conformations of EAAT3.
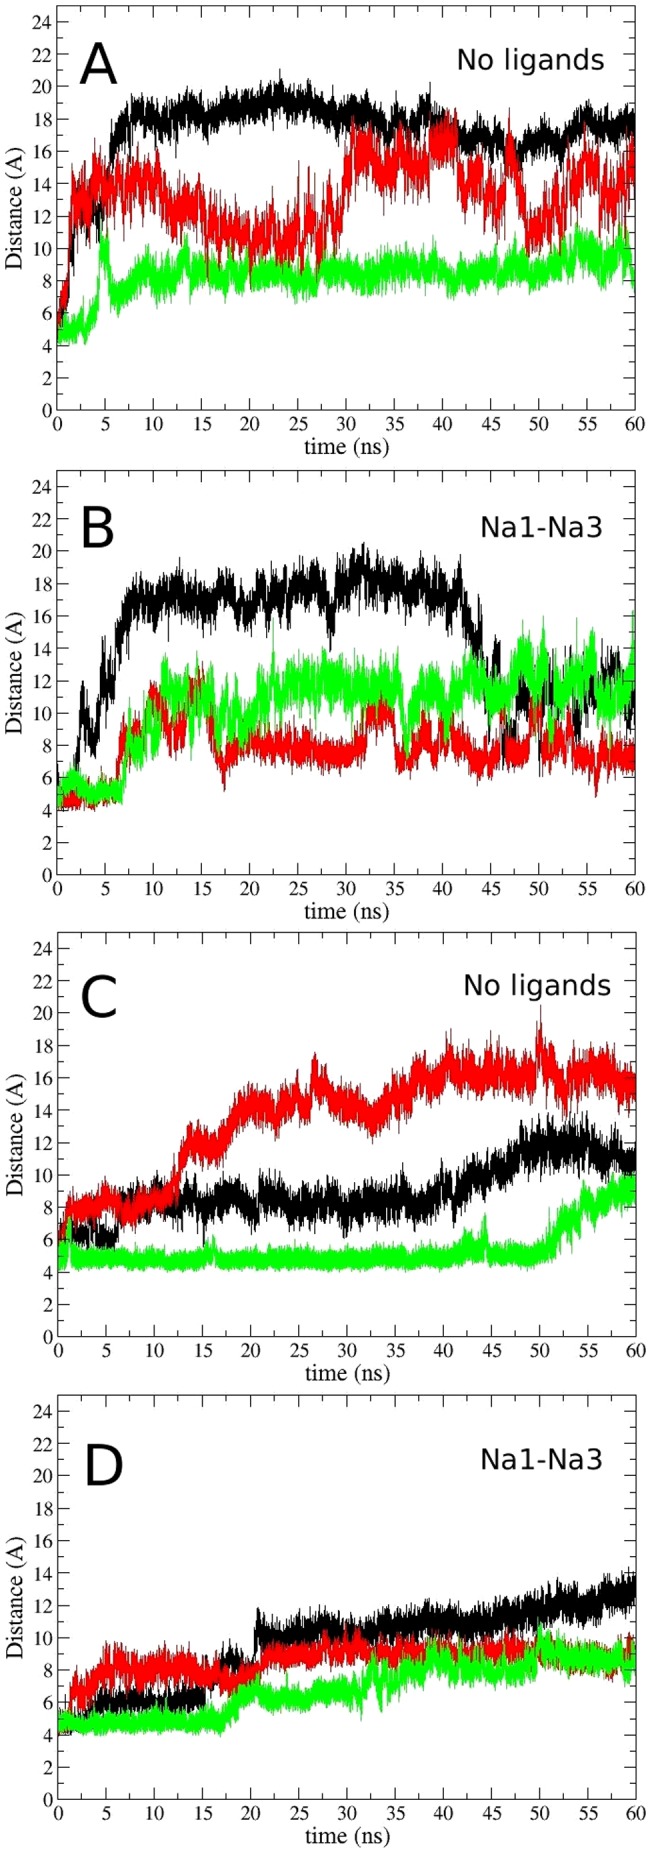
Time evolution of the S332(C )–V411(C
 ) distance in the outward-facing conformation with (A) no ligands bound to the transporter, and (B) only the Na1 and Na3 ions bound to the transporter. The same for the inward-facing conformation with (C) no ligands bound to the transporter, and (D) only the Na1 and Na3 ions bound to the transporter. The color code for the subunits are A (black), B (red), and C (green).