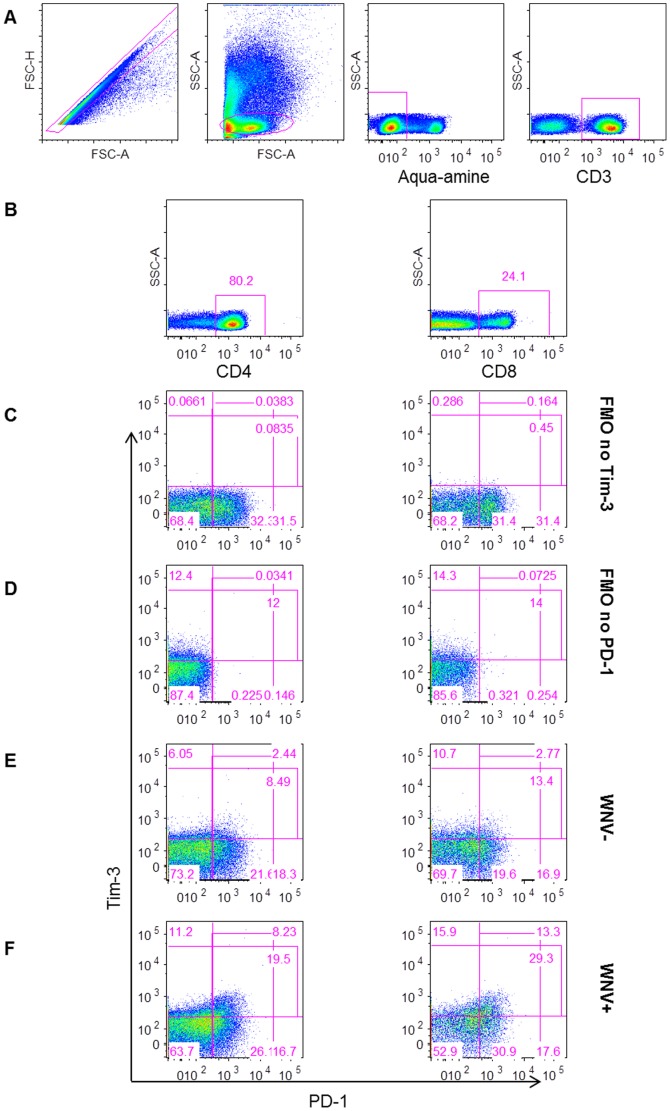
Figure 1. Gating strategy for measuring Tim-3 and PD-1 inhibitory receptors on T cells.
The plots show (A) the gating strategy for live CD3+ lymphocytes, (B) for CD4+ (left) and CD8+ (right) T cells. Gates were set on FMO no Tim-3 (C) and FMO no PD-1 (D). The gating of cells expressing Tim-3 and PD-1 is shown for representative (E) WNV− and (F) WNV+ subjects day 14 post-index donation.

