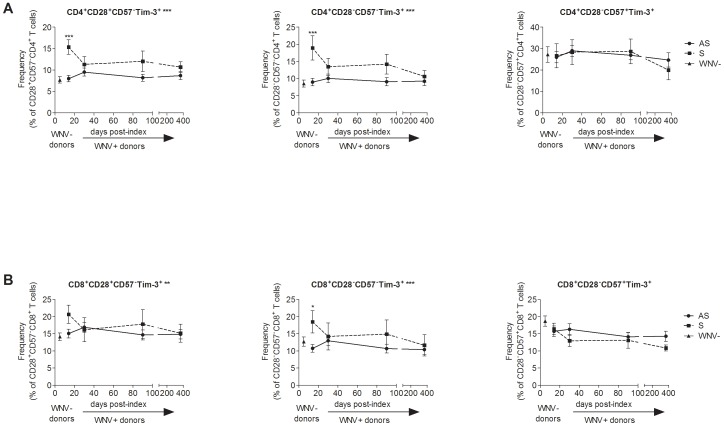
Figure 4. Differentiation status and functional capacity of Tim-3+ T cells in acute West Nile virus infection.
The graphs show, through the course of WNV infection, the frequencies of Tim-3+ CD28+CD57−, CD28−CD57− and CD28−CD57+ (A) CD4+ and (B) CD8+ T cell subsets in asymptomatic (AS, circles/solid lines, n = 24) and symptomatic (S, squares/dash lines, n = 8) WNV+ subjects 14, 30, 90, and 365 days post-index donation. The frequencies of the same cells in uninfected controls are displayed (WNV-, triangles, n = 26). The symbols indicate the means and the error bars represent the SEM. **p <0.01, *p <0.05, and *** p <0.001 by Mann-Whitney. The p-values of the comparison between asymptomatic and symptomatic groups are indicated by ** adjacent to the cell subset title for p <0.01 over the time post-index by GEE.

