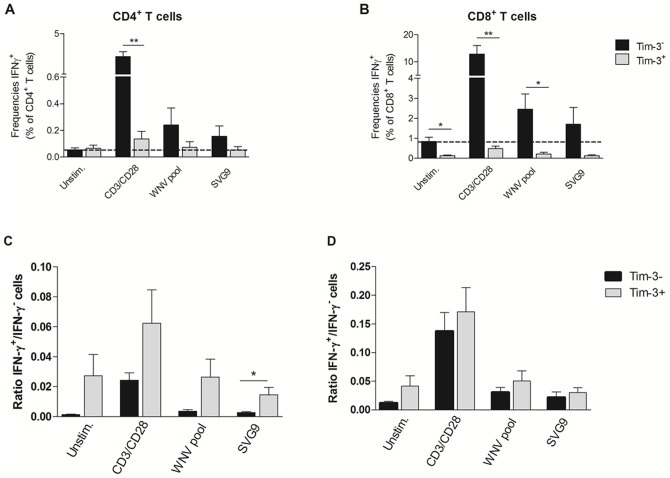
Figure 6. Phenotyping IFN-γ secreting T cells in response to stimulation.
The frequency of IFN-γ-producing Tim-3− and Tim-3+ CD4+ T cells (A) and CD8+ T cells (B) collected 30 days post-index from 6 HLA-A02 WNV-infected donors are shown after stimulation in the presence or absence of anti-CD3/anti-CD28 monoclonal antibodies, WNV peptide pool, and SVG9 peptide; Ratios of IFN-γ+/IFN-γ− cells within Tim-3− and Tim-3+ are shown for CD4+ T cells (C) and CD8+ T cells (D). The histograms indicate the means and the error bars represent the SEM. **p <0.01, *p <0.05, and *** p <0.001 by t-test.

