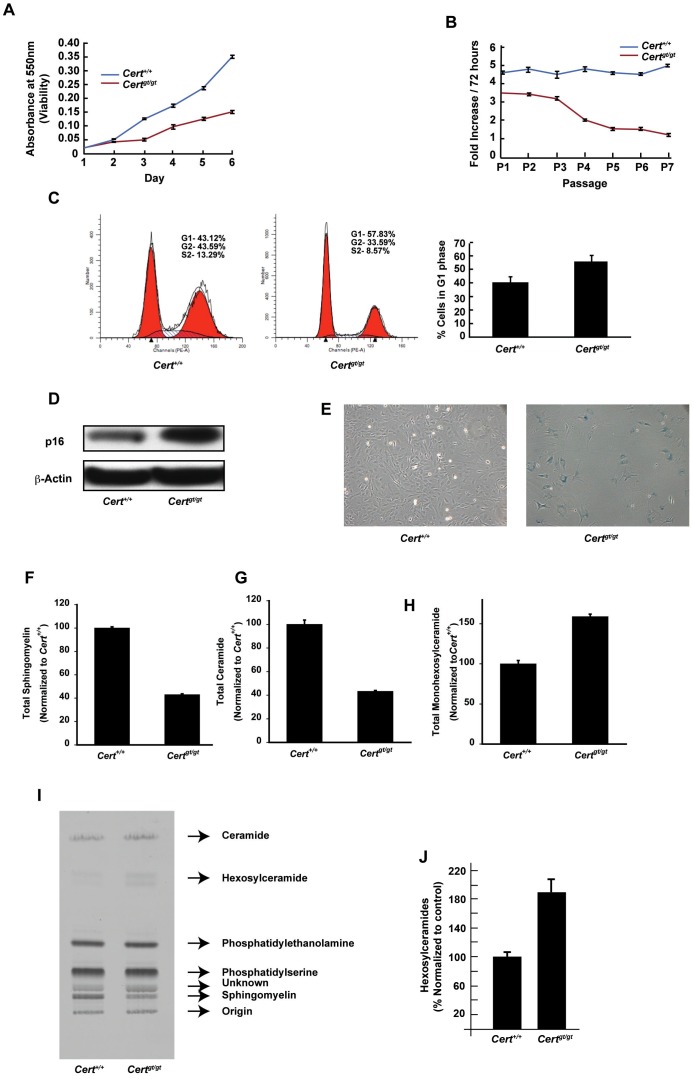
Figure 1. Certgt/gt MEFs undergo senescence and have dysregulated sphingolipid metabolism.
(A) Cell viability assay of Certgt/gt and Cert+/+ MEFs by MTT assay. (B) Mitotic index of Certgt/gt Cert+/+ MEFs measured over seven passages (C) The MEFs were analyzed by FACS analysis (representative plots on the left) using propidium iodide for staining cells and the percentage of cells in G1 phase measured and plotted (right panel). The actual raw data from a representative experiment along with the multiline plot generated using ModFit LT computer software is shown in the left panels. The red histograms show the percent cells in G1 and G2/M phase while the hatched plot shows the cells in S phase. (D) Upregulation of p16 Certgt/gt MEFs. (E) Morphological analysis of late passage cells from control and mutant MEFs. The mutant MEFs show flattened morphology typical of senescent cells. (F) The total sphingomyelin and (G) total ceramide was decreased while total hexosylceramides (H) were increased in the in Certgt/gt compared to MEFs derived from Cert+/+ as measured by mass spectrometry. (I) Metabolic labeling with radiolabeled serine showed that the levels of sphingomyelin synthesized by the de novo pathway is decreased, while hexosylceramide is increased during the period of pulse chase. (J) The quantification of hexosylceramides from three metabolic labeling experiments is shown. The bands representing hexosylceramides were scraped and counted in a liquid scintillation counter and normalized to the wild type levels.

