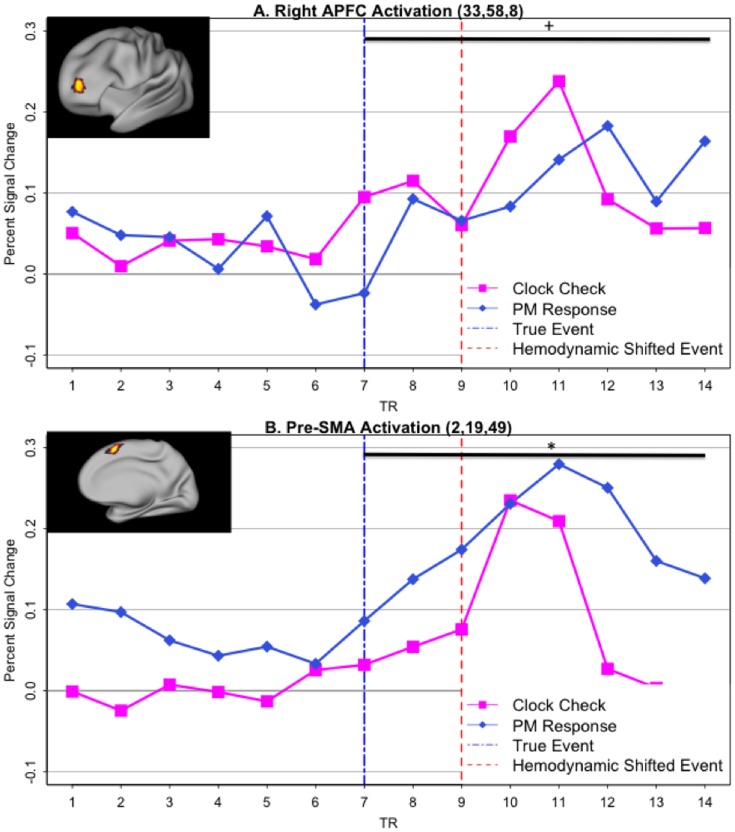
Figure 5. Peri-event timecourses of PM-response activation.
Timecourses refer to 14-TR epochs (35 seconds) centered at the time of PM-response/clock-onset (TR-7, blue dashed vertical bar) A. Right aPFC ROI (location shown in inset), exhibiting weaker activation for time-based PM responses (navy) relative to clock-checks (purple). Activity is reduced and delayed both prior to the PM response (TRs 7–9) and following it (TRs 10–14). The horizontal bar indicates the period in which a trend-level significant (p = .07) condition x time interaction was observed. B. Contrasting pattern observed in pre-SMA (location shown in inset), with greater activation for PM responses relative to clock-checks. The horizontal bar indicates the period over which a significant condition x time interaction was observed (p<.05).

