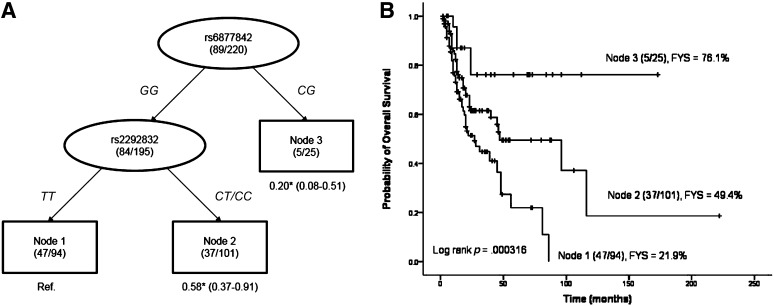
Figure 2.
Survivability defined by high-order interactions between SNPs. (A): Survival tree analysis of survival of patients with T-cell lymphoma. (B): Overall survival according to different nodes identified by survival tree analysis. The number under each node represents the hazard ratio with 95% confidence interval in parenthesis. *, p < .05. Abbreviation: C, cytosine; FYS, 5-year overall survival rate; G, guanine; T, thymine.

