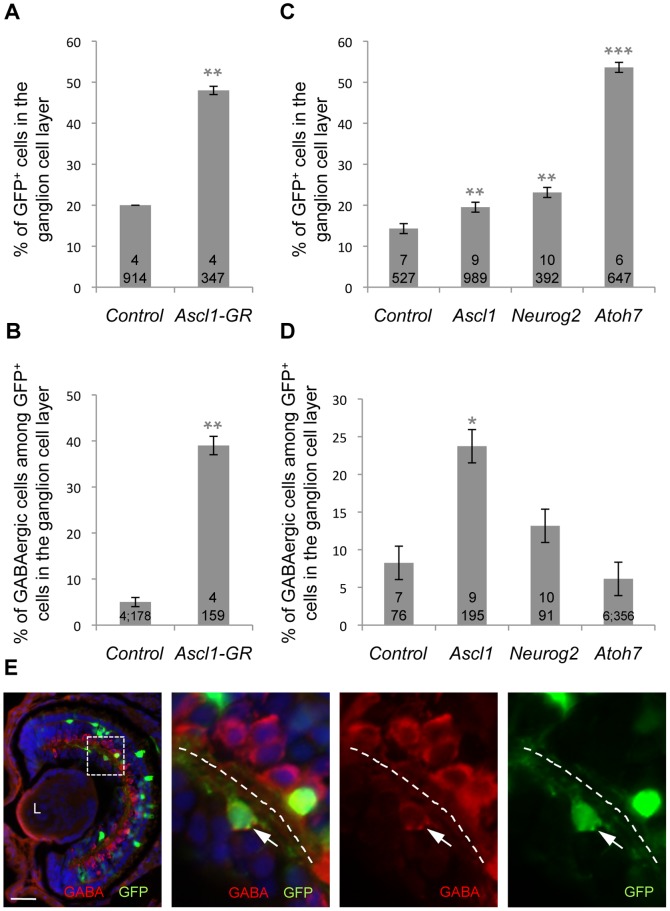
Figure 2. Ascl1 overexpression in the retina favours GABAergic cell genesis.
Cell fate analysis following overexpression of the indicated construct by either mRNA injection in one blastomere at the four-cell stage and dex treatment at stage 16 (A, B; analysis at stage 38) or in vivo lipofection at the neurula stage (C, D; analysis at stage 41). In both cases, GFP was used as a tracer to visualize injected/transfected cells. Note that Ascl1, Neurog2 and Atoh7 lipofections all result in an increased percentage of cells in the ganglion cell layer but only Ascl1-overexpressing cells are biased towards a GABAergic destiny. Total number of analyzed retinas and counted cells per condition is indicated in each bar. Values are given as mean +/– s.e.m. p<0,001 (***), p<0,01 (**), p<0,05 (*) (Student’s t-test). (E) shows a typical section of stage 41 retinas lipofected with GFP plus Ascl1 and immunostained with anti-GABA (red) and anti-GFP (green) antibodies. Panels on the right are higher magnifications of the dotted square delineated region. The dotted line indicates the inner plexiform layer, with the ganglion cell layer on the left and the inner nuclear layer on the right. White arrow points to a transfected GABA-positive cell within the ganglion cell layer. L: Lens. Scale bar represents 300 μm (heads) or 50 μm (sections).

