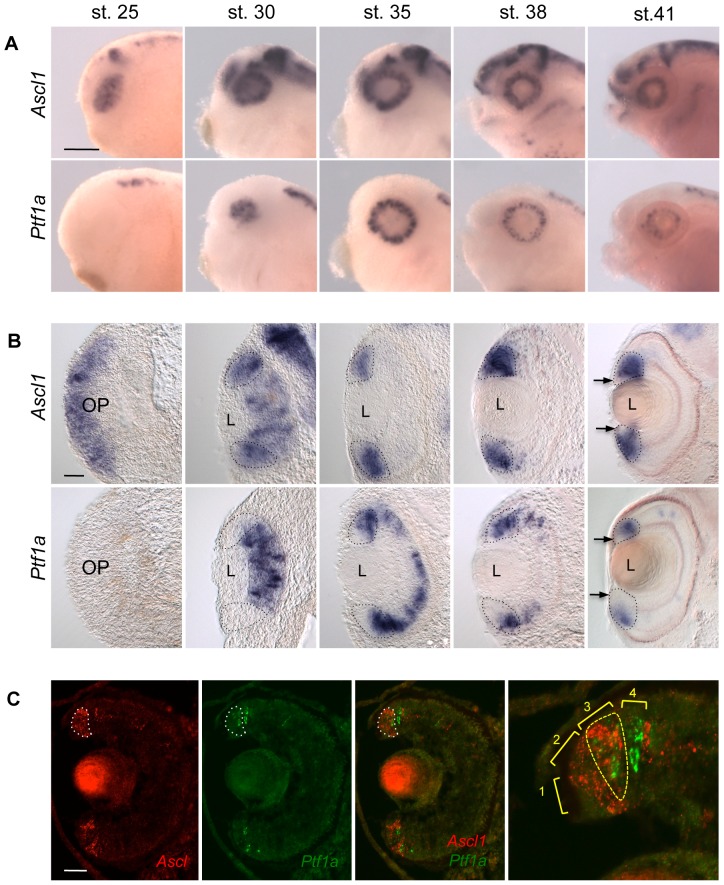
Figure 10. Comparison of Ascl1 and Ptf1a expression patterns during retinogenesis.
(A, B) Whole mount in situ hybridization analysis of Ascl1 and Ptf1a expression during retinogenesis. Shown are representative pictures of the observed labelling in the head region (A; lateral views, anterior on the left) and on retinal cross sections (B; dorsal side up). Ascl1 and Ptf1a are expressed in overlapping domains of the neural retina at stage 30 and in the ciliary marginal zone (CMZ, delineated by doted line) from stage 35 onwards. (C) Double fluorescent in situ hybridization against Ptf1a (green) and Ascl1 (red) performed on stage 40 retinal sections. Ascl1 staining in the CMZ is delineated by a white doted line. Panel on the right shows a magnification of the dorsal CMZ. Neither Ascl1 nor Ptf1a are detected in zone 1 (stem cell compartment). In zone 2 (early progenitors), only Ascl1 is expressed. The expression patterns of both genes overlap in zone 3 (late progenitors; yellow doted line). In zone 4 (postmitotic retinoblasts), Ascl1 expression vanishes while that of Ptf1a persists. OP: Optic vesicle, L: Lens. Scale bar represents 300 μm (A) or 50 μm (B, C).

