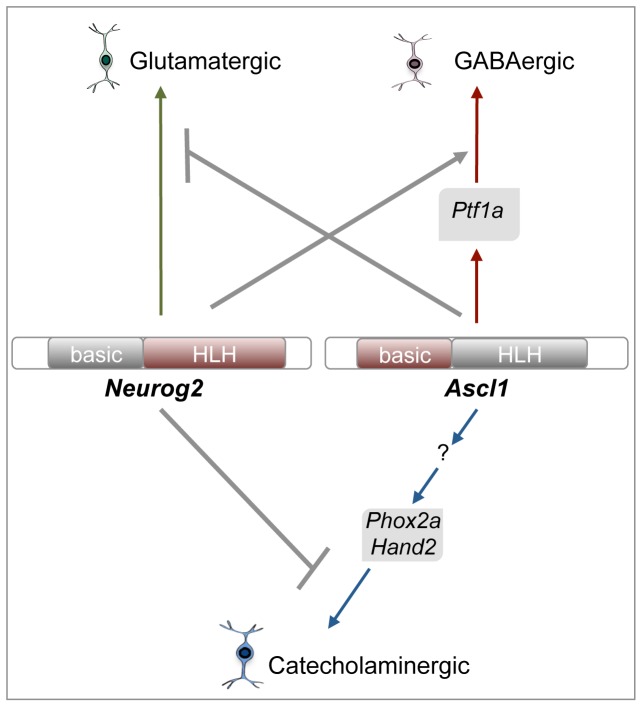
Figure 12. Summary of Ascl1 genetic network in neuronal subtype specification.
Green, red and blue arrows point to neuronal subtypes induced by Neurog2 and Ascl1. Identified downstream components required for their respective activities are indicated. Grey arrows illustrate epistatic relationships between Neurog2 and Ascl1, as suggested by our results. Protein domains in red confer to Ascl1 and Neurog2 their specific GABAergic/catecholaminergic and glutamatergic activities, respectively (see text for more details).

