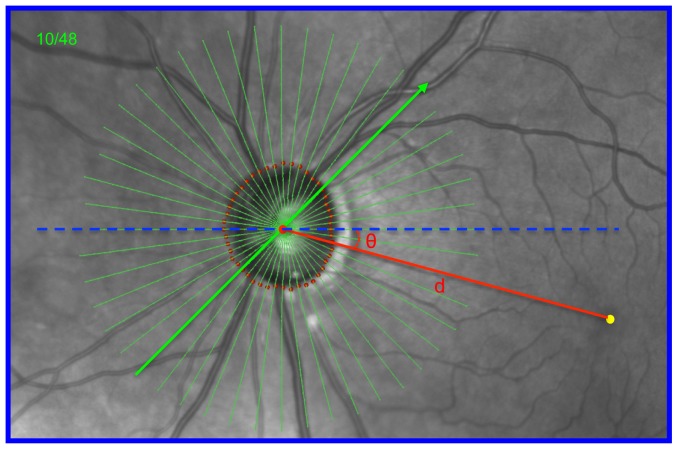
Figure 1. Identification of the fovea-to-BMO centroid (FoBMO) axis (red) relative to the Acquired Image Frame (AIF- blue outline) horizontal axis (dashed blue line), the FoBMO angle (θ) and the FoBMO distance (d) on the infrared (IR) fundus image of a representative study eye (DIS368).
In each study eye, the FoBMO axis, the FoBMO angle and the FoBMO distance were digitally generated relative to the SDOCT ONH data set through the following steps. 1) The fovea (yellow dot) was digitally identified on the IR image by one clinician (CFB). 2) The delineated BMO points from 24 of the 48 acquired SDOCT B-scans were projected onto the IR image plane allowing the geometric center (BMO centroid - large red dot) to be located relative to the acquired SDOCT data. 3) The FoBMO axis was defined to be the line (red) connecting the fovea and BMO centroid. 4) The FoBMO angle (θ) was defined to be the angle between the FoBMO axis and the AIF horizontal axis (blue dashed line). The FoBMO distance (d) was defined to be the distance between the BMO centroid and the assigned fovea. The FoBMO angle is −16° and the FoBMO distance is 4.3 mm in this eye (see Figure 4).

