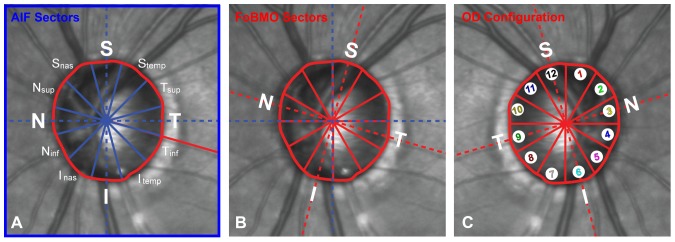
Figure 2. AIF versus FoBMO 30° ONH regionalization of a representative study eye (DIS368).

This is the same eye (DIS368) as shown in Figure 1. (A) AIF (blue outline) regionalization with the naming convention for the twelve 30° sectors. (B) FoBMO regionalization of the same eye. Note that for this eye the actual anatomy being measured within the Superior (S) sector (as an example) is different within the AIF (A) compared to the FoBMO (B) regions. (C) FoBMO 30° sectors from the left eye shown in panel B, flipped into OD configuration and numbered with separate colors in the manner in which the data for all 222 eyes are presented in Figure 9.
