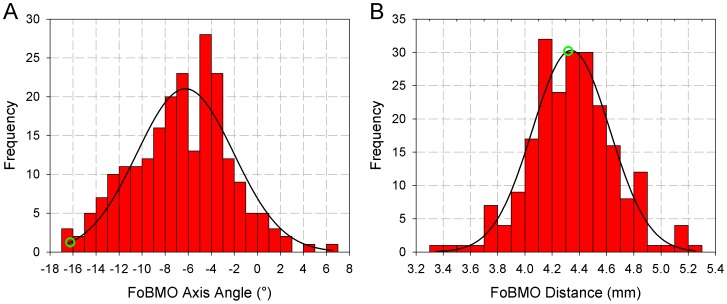
Figure 4. Histograms of FoBMO axis angle (A) and distance (B).
FoBMO axis angle ranges from −17° to 7° (corresponding to “θ” in Figure 2A) while FoBMO distance ranges from 3.4 mm to 5.4 mm (corresponding to “d” in Figure 2B). The black lines are the Gaussian fits for the histograms. Shapiro-Wilk normality test finds p = 0.291 for FoBMO angle and p = 0.294, suggesting both histograms are normally distributed. The green circle represents the eye “DIS368” (Figures 1 and 2). The FoBMO Axis Angle data (panel A) appeared within a previous publication as part of a written communication (Chauhan BC and Burgoyne CF (2013) From clinical examination of the optic disc to clinical assessment of the optic nerve head: a paradigm change. Am J Ophthalmol 156: 218-227 e212.).

