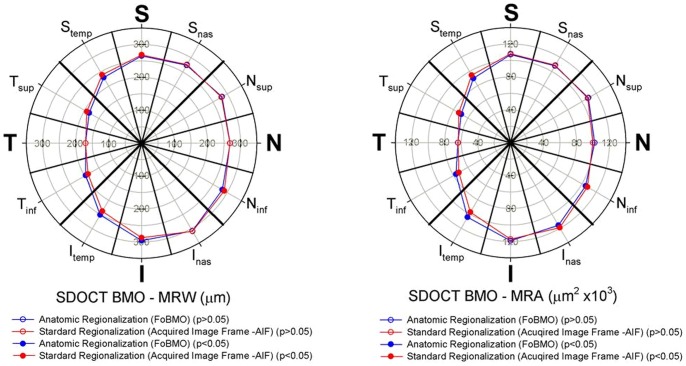
Figure 7. Mean sectoral MRW (left) and MRA (right) for FoBMO regionalization (red) and AIF regionalization (blue) for all 222 study eyes.
Wilcoxon signed rank test with Bonferroni correction was applied to compare the two means in the twelve sectors. Sectors of which differences were statistically significant (p<0.05) were shown in solid symbols while sectors of which differences were not statistically significant (p>0.05) were shown in open symbols. These data suggest that when reported as the means of all 222 eyes, the sectoral discordance between AIF and FoBMO regionalization is statistically significant but small. (See Supplemental Table S1 for the sectoral mean values and p values).

