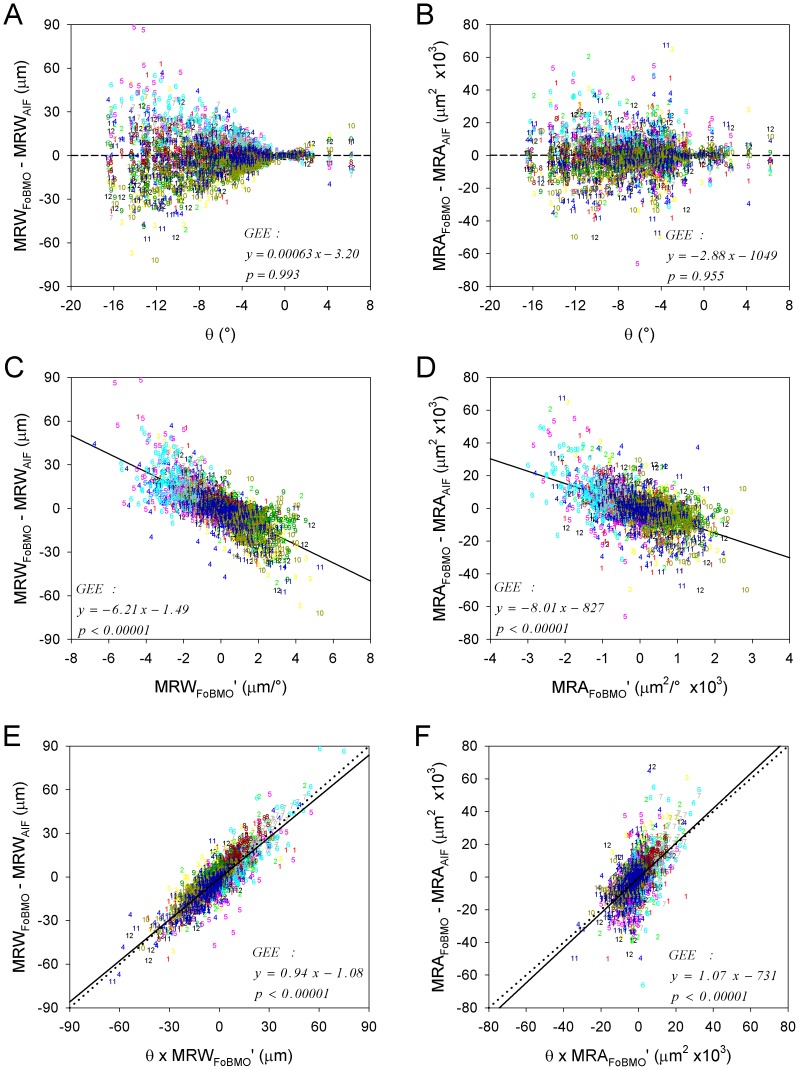
Figure 9. Sectoral FoBMO vs. AIF discordance for MRW (left) and MRA (right) predicted by a univariate generalized estimating equation (GEE) model using FoBMO angle (A & B), one-sided rim gradient (C & D) (see methods) and the interaction of both (E & F).
The color coded numbers (1–12) correspond to the FoBMO 30° sectors of each study eye in right eye configuration (Figure 8A and B) expressed as clock-hours (12 - superior, 3 - nasal, 6 - inferior and 9 – temporal, see Figure 2). Eye-specific sectoral AIF vs. FoBMO discordance for both MRW and MRA is better predicted by a combination of FoBMO angle (θ) and one-sided sectoral rim gradient (E & F) than by either, alone. Qualitative inspection of these data suggests that sectors from the inferior and superior quadrants commonly demonstrate the highest sectoral AIF versus FoBMO discordance for both MRW and MRA.

