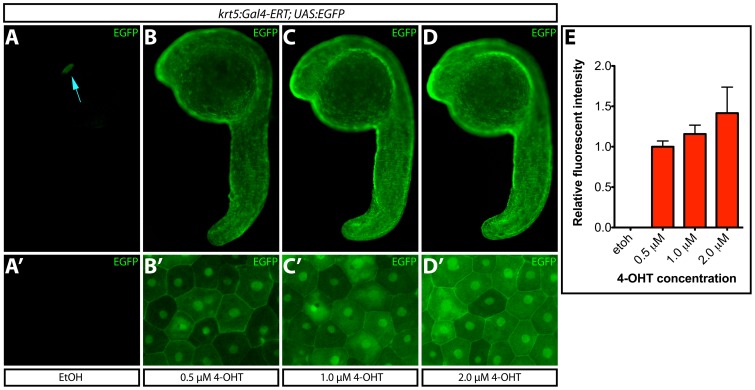
Figure 3. Transgene expression levels depend upon 4-OHT dosage.
(A–D) EGFP expression upon treatment of Tg(krt5:Gal4-ERT-VP16; UAS:EGFP) zebrafish with ethanol or the indicated dose of 4-OHT from 4–24 hpf. The blue arrow indicates myl7:ECFP expression. (A′–D′) High-magnification images of ventral epidermis from fish in each treatment group. (E) Normalized EGFP intensity (to the 0.5 μM 4-OHT treated group) of fish treated with ethanol or 4-OHT. Error bars represent standard deviations.

