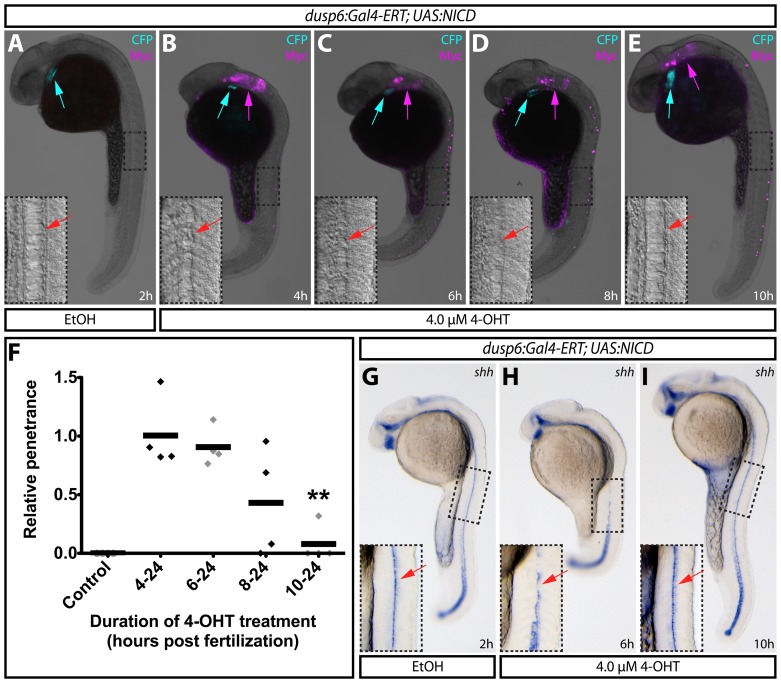
Figure 6. Using inducible expression to define temporal roles of Notch1 signaling in notochord development.
(A–E) Expression of myc-tagged NICD by immunostaining with myc antibodies on 24 hpf Tg(dusp6:Gal4-ERT-VP16; UAS:NICD) embryos treated with ethanol (A) or 4 μM 4-OHT at the indicated times (B–E). Blue arrows indicate myocardial ECFP expression to mark transgenic animals and magenta arrows show expression of myc-tagged NICD. Panel insets display high magnification images of boxed regions where red arrows indicate the notochord (A and E) and the missing notochord (B–D). (F) Normalized penetrance of notochord defects in Tg(dusp6:Gal4-ERT-VP16; UAS:NICD) animals treated with 4-OHT at the indicated stages of development. Each data point represents the normalized fraction of affected animals in sets of treated embryos from four independent clutches. The data is normalized to the average fraction of abnormal fish in the four 4–24 h sets. The double asterisk indicates a significant difference between 4–24 h and 10–24 h 4-OHT treated fish (P<0.005). (G–I) Expression of shha in the floor plate of animals treated with ethanol (G) or with 4-OHT for the indicated times (H–I). Boxed regions are shown at higher magnification in the panel insets. Red arrows indicate shha expressing floor plate cells.

