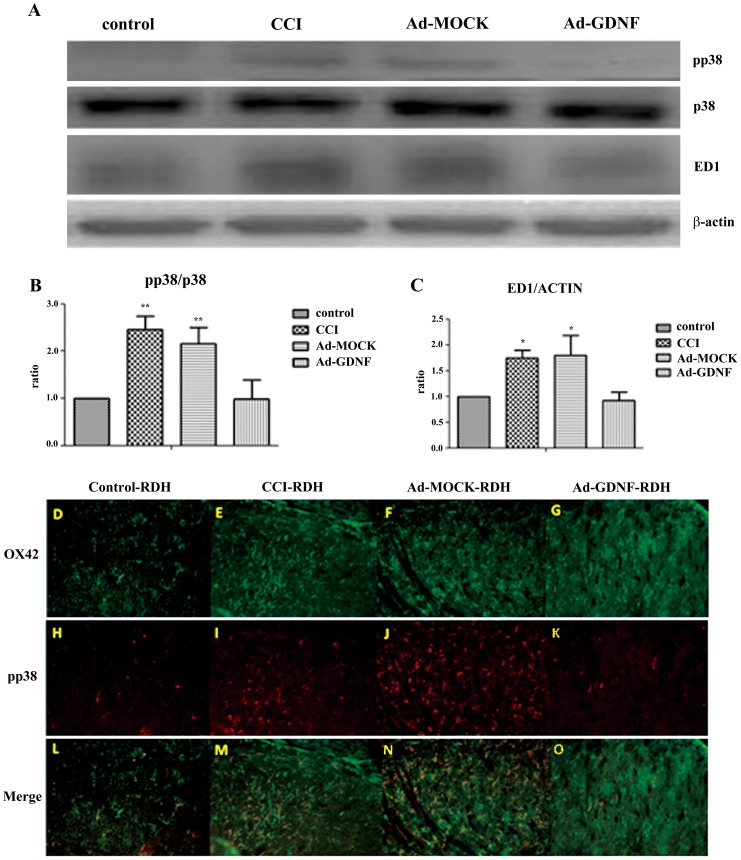
Figure 4. Immunoblotting showing protein expression level with respect to phosphor-p38, p38 and ED-1.
Western blot analysis showing the expression levels of phospho-p38, p38 and ED-1 in control, CCI, and ipsilateral SCDH with intramuscular injection of Ad-MOCK or Ad-GDNF (A). The expression levels of phospho-p38 and ED-1 with respect to each tested group were shown as bar charts of relative ratio normalized with expression levels of p38 and β-actin, respectively (B-C). *P<0.05, **P<0.01 compared with the Ad-GDNF group. Double immunofluorescence staining of OX42 (D–G), a microglia marker, and phosphor-p38 (H–K) in different tested groups. The expression levels with respect to OX42 and phospho-p38 were obviously enhanced after CCI, but phospho-p38 was no longer highly expressed after administration of Ad-GDNF as shown in merged images (L–O).

