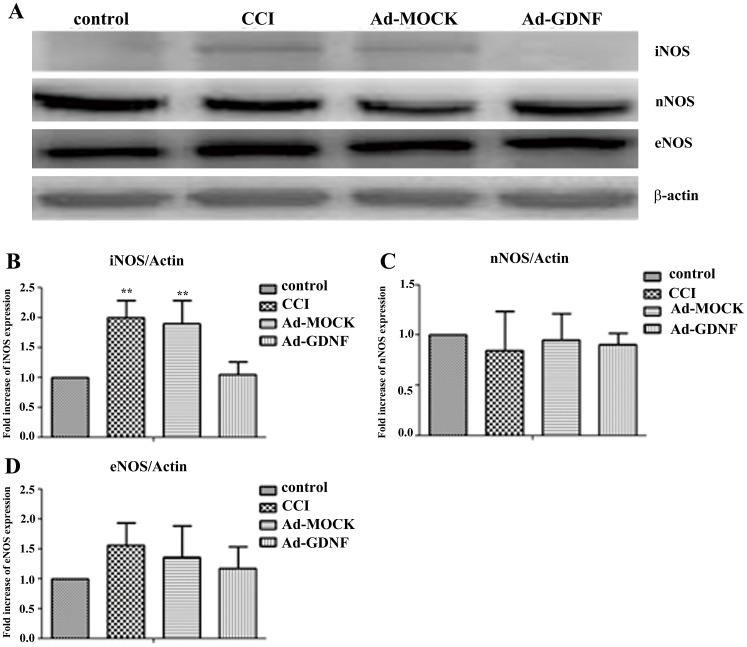
Figure 10. Immunoblotting showing protein expression level with respect to different NOS isoform.
Western blot analysis showing the expression levels of iNOS, nNOS and eNOS in control, CCI, and ipsilateral SCDH with intramuscular injection with Ad-MOCK or Ad-GDNF (A). The expression levels of iNOS, nNOS and eNOS with respect to each tested group were shown as bar charts of relative ratio normalized with the expression levels of β-actin (B–D). **P<0.01 compared with Ad-GDNF group.

