Figure 3.
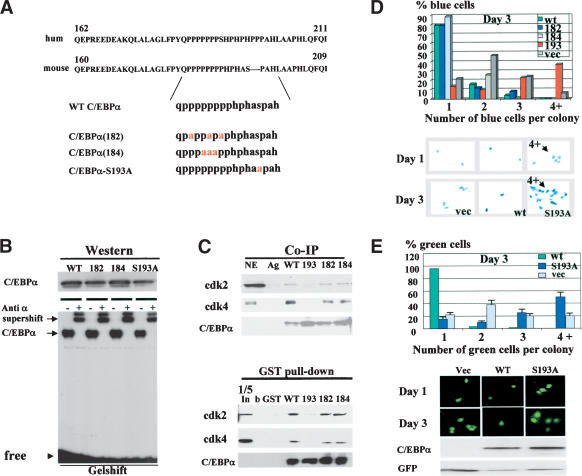
Growth inhibitory activity of C/EBPα is dependent on Ser 193. (A) Amino acid sequences of growth inhibitory regions of human (upper) and mouse (bottom) C/EBPα. C/EBPα constructs with point mutations within the growth inhibitory region of C/EBPα are shown below. (B) Expression and DNA binding activity of the C/EBPα mutant constructs. 3T3-L1 cells were transfected with C/EBPα constructs, and proteins were isolated and examined by Western blotting (upper) or by gelshift assays with C/EBP consensus bZIP. Antibodies to C/EBPα were incorporated into the binding reactions before the probe addition. (C) C/EBPα-S193A mutant does not interact with cdk2 and cdk4. The upper image (Co-IP) shows coimmunoprecipitation (C/EBPα-IP) of cdk2 and cdk4 from cells transfected with C/EBPα mutants shown at the top. (Ag) Mock control. The bottom panel shows C/EBPα in immunoprecipitates. The bottom image (GST pull-down) shows GST pull-down experiments with C/EBPα mutants. (b) Beads only; (In) 1/5 part of the input. (D) The C/EBPα-S193A mutant does not inhibit proliferation of 3T3-L1 cells. C/EBPα mutants were cotransfected with β-gal into 3T3-L1 cells and cells were stained for β-gal activity at day 1 and day 3 after transfections. Proliferation was examined by counting blue cell clusters. A summary of three independent experiments is shown. The bottom image shows a typical picture of blue 3T3-L1 cells at day 3 after transfections. (E) Colony growth assay with pAdTrack–C/EBPα constructs. The bottom image shows a typical picture of cells at days 1 and 3 after transfections. Western blotting indicates levels of C/EBPα at the end of experiment. Bar graphs represent a summary of three independent experiments.

