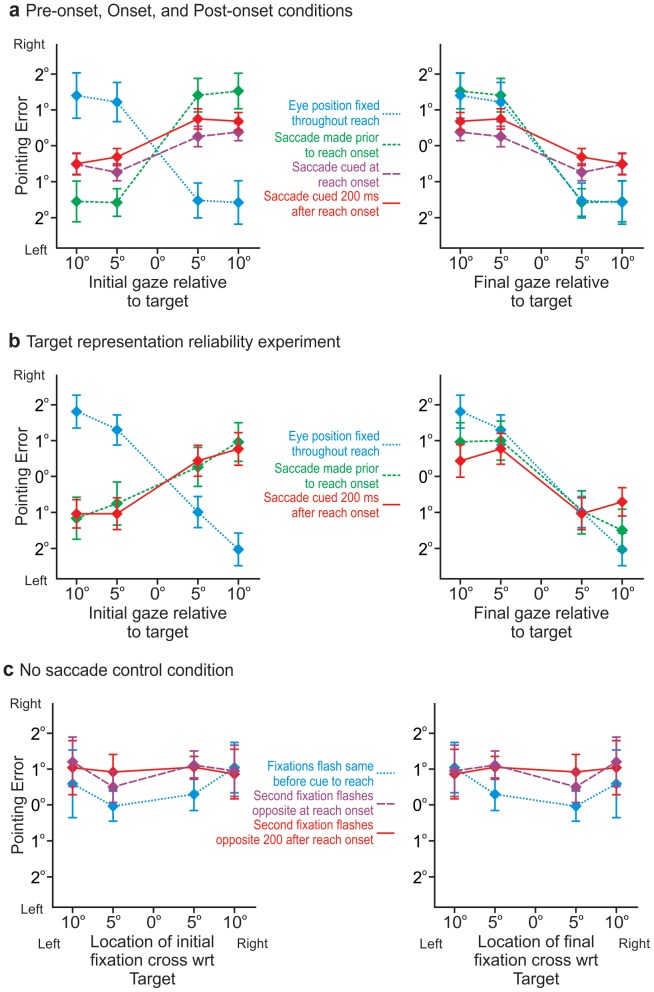
Figure 2. Group mean reach endpoint errors.
a: Group mean horizontal pointing errors as a function of target-relative gaze direction for IGD (left panel) and for FGD (right panel). The blue curve represents errors when the eyes remain fixed after moving once following initial foveation of the target (i.e., IGD = FGD; ⅓ of all trials in each condition. The green curve represents reach errors when the eyes change position again 200ms before the point cue. The purple and red curves represent the errors made when the second saccade is cued at reach onset or 200ms after reach onset respectively – these errors are the same in magnitude and direction and do not differ from the green curve. b: Group mean horizontal pointing errors as a function of target-relative gaze direction for IGD (left panel) and for FGD (right panel) from the Target representation reliability experiment. Blue, green, red curves are as in Figure 2a. c: Horizontal pointing error from the No saccade control condition. When the fixation cross appeared and stayed stationary (blue) or jumped to the opposite side of the remembered target location at reach onset (green) or 200ms after reach onset (red), but subjects continued fixating the location where the target had been displayed rather than saccading to the fixation crosses, reaches were unaffected. Error bars in panels a-c represent SEM.

