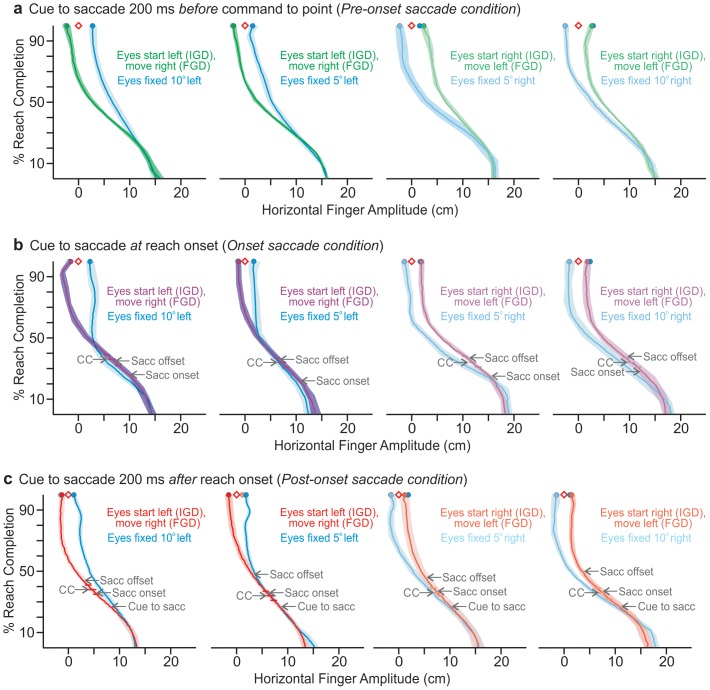
Figure 4. Above view of group mean fingertip trajectories for each condition.
Shaded regions represent ±2SEM, horizontal bars indicate occurrence of mean peak jerk (with 95% CI) reflecting course correction (CC), and saccadic onsets and offsets are marked. Horizontal fingertip trajectory is plotted as a function of percent reach completion. The diamonds represent the remembered target locations, and the filled circles represent reach endpoint. Colours represent conditions as in Figure 2a. In all conditions reach endpoint error when the eyes shift is opposite to when the eyes remain fixed. This is true regardless of if the second saccade occurs 200ms before the command to point as in a, or if the saccade concludes as late as 50% of reach completion as in d. Minor differences in start position reflect variation in finger-on-mouse placement and/or the position of the mouse on the table.

