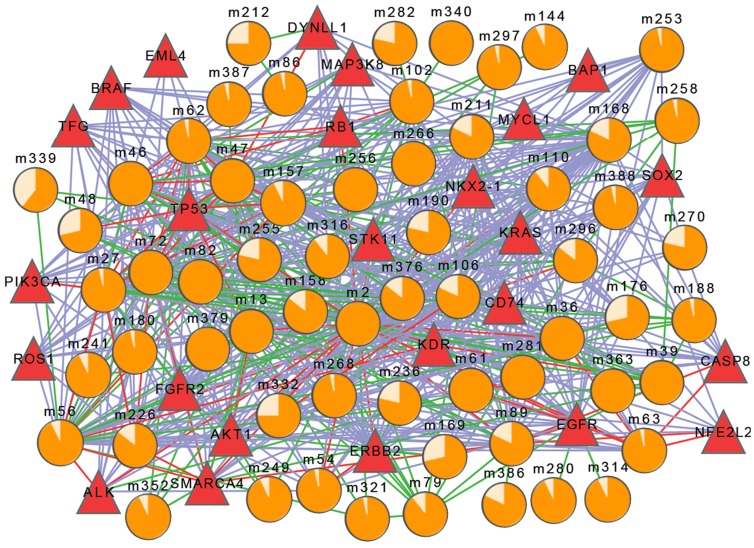
Figure 4. The relationship network of cancer-risk modules and lung cancer genes.
The circles indicate cancer-risk modules, and the proportion of orange parts indicates cancer risk (Mrisk). The disease-causing genes is represented by red triangles. Edges' colors indicate the relationships, purple represents for the protein-protein interaction, green for function sharing, and red for both functional and interaction relationship.

