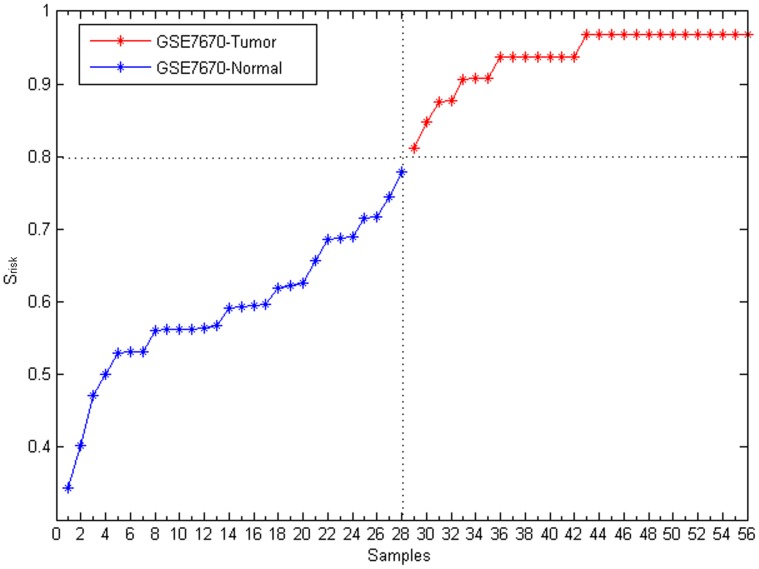
Figure 5. The lung cancer risk of each sample in GSE7670.
X-axis is samples. Y-axis is the lung cancer risk score of individual samples, and it is ranked from smallest to largest. Red represents lung cancer samples; and blue represents normal samples.

