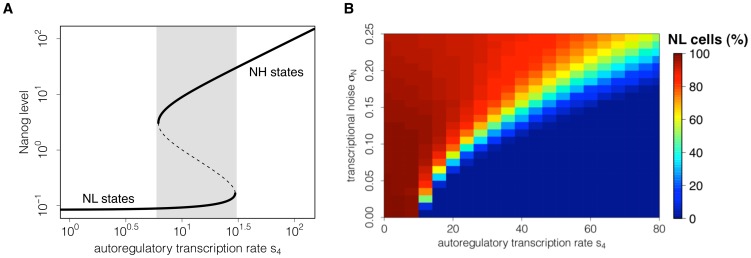
Figure 2. Dependency of stable Nanog states on Nanog autoregulation and noise.
(A) The bifurcation diagram indicates the existence of Nanog states depending on the autoregulatory transcription rate s4. The lower solid line shows the existence of Nanog-low (NL) states and the upper solid line shows the existence of Nanog-high (NH) states. Within the bistable region (shaded in grey) coexisting stable states are separated by unstable states (dashed line). (B) Simulating a cell population, the heat map illustrates the proportion of NL cells depending on the transcription rate s4 and on the transcriptional noise σN at time point t = 4320min (i.e. 3 days of in silico culture). For any value of the background noise, an increase in the transcription rate s4 reduces the proportion of NL cells.

