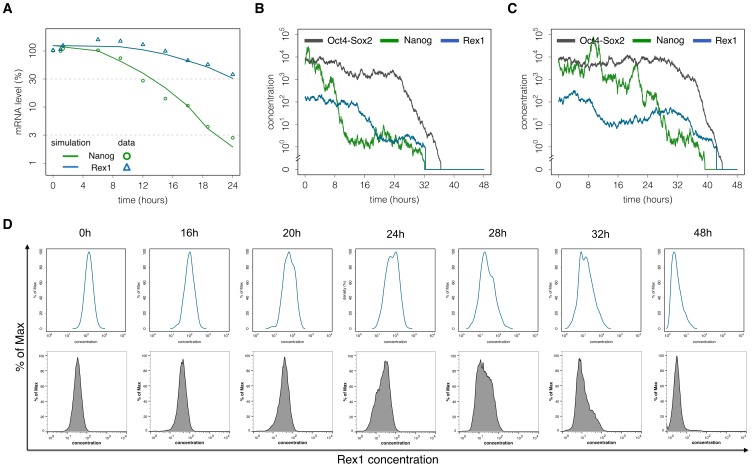
Figure 6. The differentiation process of mESCs.
(A) Experimental and simulated TF kinetics. mRNA levels of Nanog (green circles) and Rex1 (blue triangles) are measured after 2i withdrawal and used to adapt the velocity of the differentiation process in terms of the proposed network model. Solid lines depict the respective simulation results of average Nanog and Rex1 levels. (B) – (C) Single cell trajectories. The Nanog level (green) initially switches from the NH into the NL state. Rex1 expression levels gradually decrease (blue). The Oct4-Sox2 level (black) is suddenly downregulated if the intracellular activity Yin becomes sufficiently strong. (D) Flow cytometry measurements of Rex1GFPd2 mESCs show intercellular differences in the differentiation dynamics of Rex1 (lower panel). The respective model results are consistent with the experimental findings (upper panel). The parameter set for these simulations is given in Table S2 in File S1.

