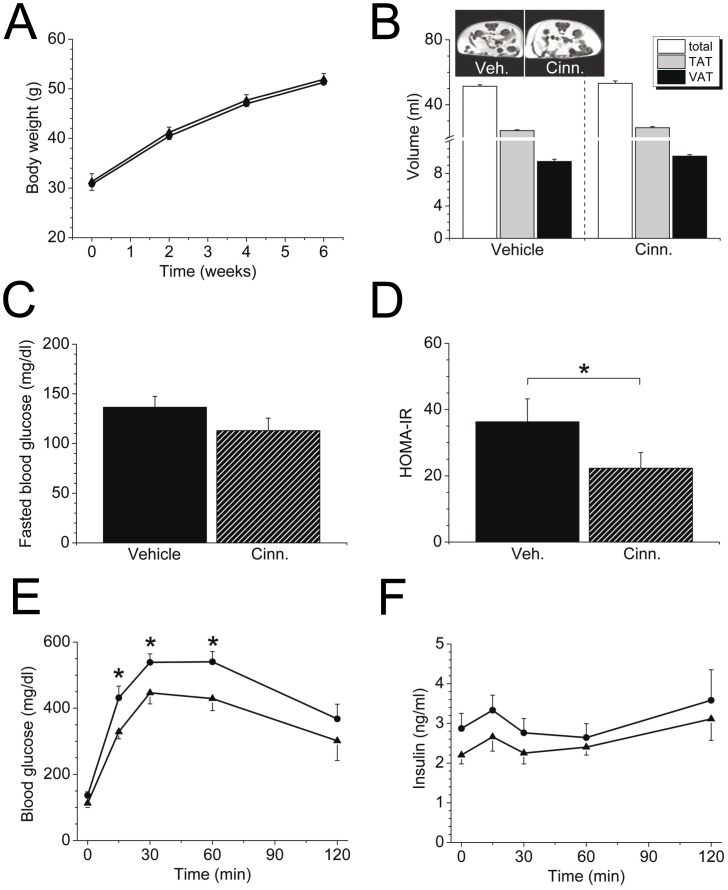
Figure 3. Metabolic consequences of cinnamon extract supplementation in chow-fed B6.V-Lep ob/J (ob/ob) mice.
Ob/ob mice were supplemented with cinnamon extract or vehicle solution for 6 weeks (n = 10/group). A: Body weight development during the supplementation period with cinnamon extract (triangles) or vehicle solution (dots). B: Magnetic resonance images of total (TAT, grey) and visceral fat (VAT, black) deposits in ob/ob mice supplemented with cinnamon extract (Cinn.) or vehicle solution (Veh.) for 6 weeks. Calculated volumes of TAT and VAT integrated over 24 slices are quantified of n = 6 mice per supplemented group. Insert: Bright (hyperintense) areas represent fat tissue. C: Fasted blood glucose concentrations of cinnamon extract- (cross-hatched) or vehicle- (filled) treated ob/ob mice after the 6 week treatment period. D: Calculated HOMA-IR in the feed-deprived state; *P<0.05. E: Blood glucose in i.p. GTT in cinnamon extract-treated (triangles) and vehicle-treated (filled dots) ob/ob mice (*P<0.05). F: Plasma insulin concentration during the GTT after cinnamon extract (triangles) or vehicle (dots) treatment. Data are presented as mean ± SEM.

