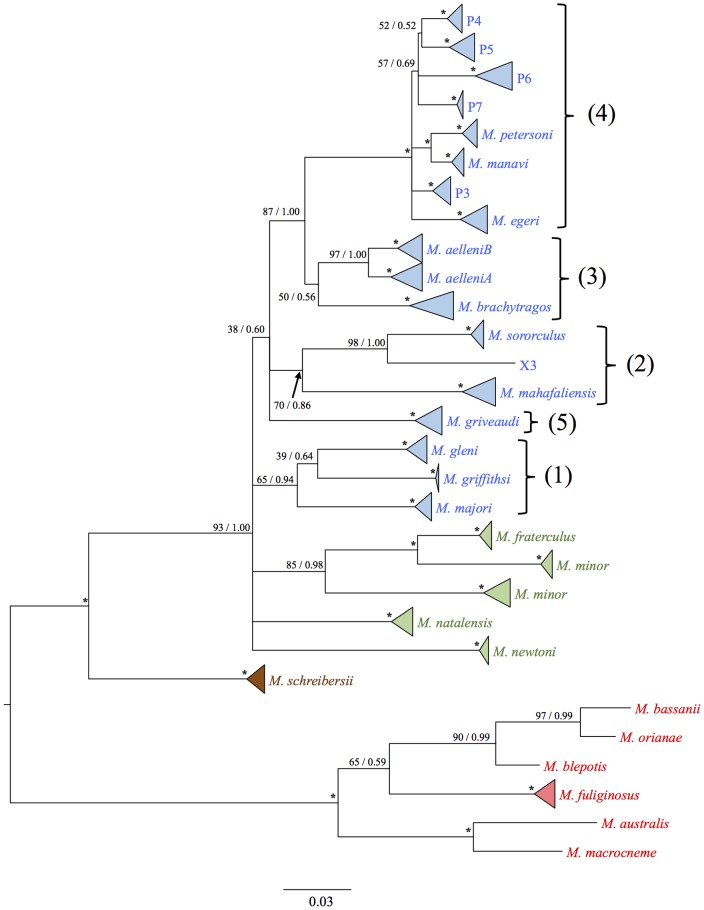
Figure 2. Bayesian majority consensus tree based on cvt-b sequence data and according to a HKY + G nucleotide substitution model.
The first number at each node represents bootstrap support according to the Maximum Likelihood analysis; the second represents Bayesian posterior probability. An asterisk (*) at a node indicates full support from both analyses, i.e. 100/1.00. Where clades contain more than a single individual, these have been collapsed into triangles. Colour coding refers to the origin of the species, as follows: Blue = Madagascar; Green = Africa; Brown = Europe; Red = Asia and Australasia. Large bold numbers beside lineages indicate the five primary lineages referred to in the text.

