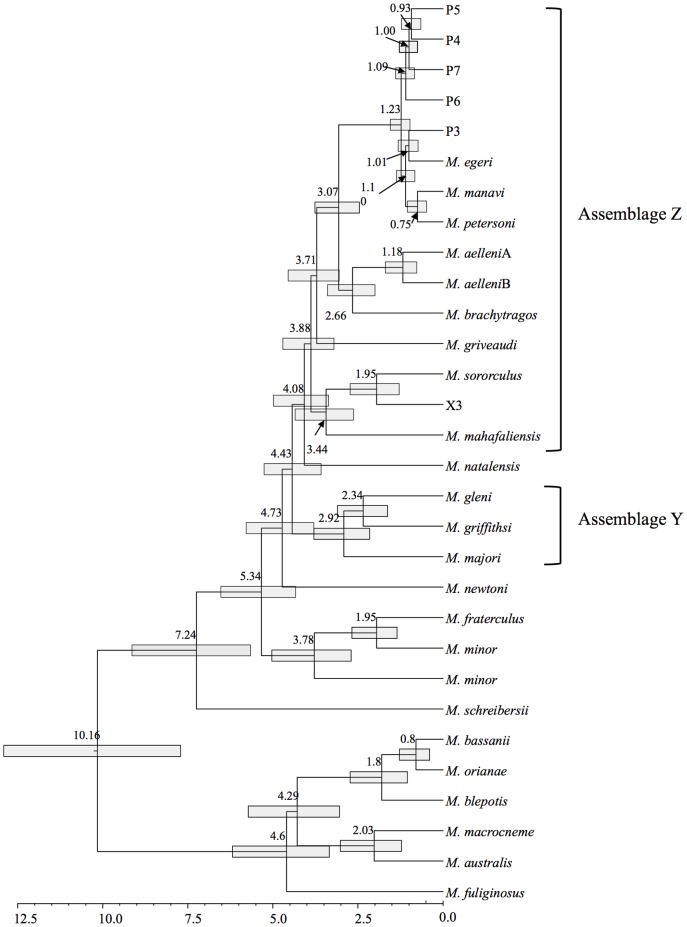
Figure 3. BEAST molecular clock analysis of representative cvt-b sequences, incorporating a HKY + G nucleotide substitution model and a Yule model of speciation.
Molecular evolutionary rates were calibrated at 2% per million years under a relaxed lognormal clock. Numbers at nodes refer to the age of the node in millions of years (my); the scale bar indicates branch length in my. Grey bars represent 95% highest posterior distributions around node age estimates. Assemblages Y and Z are indicated as noted in the text.

