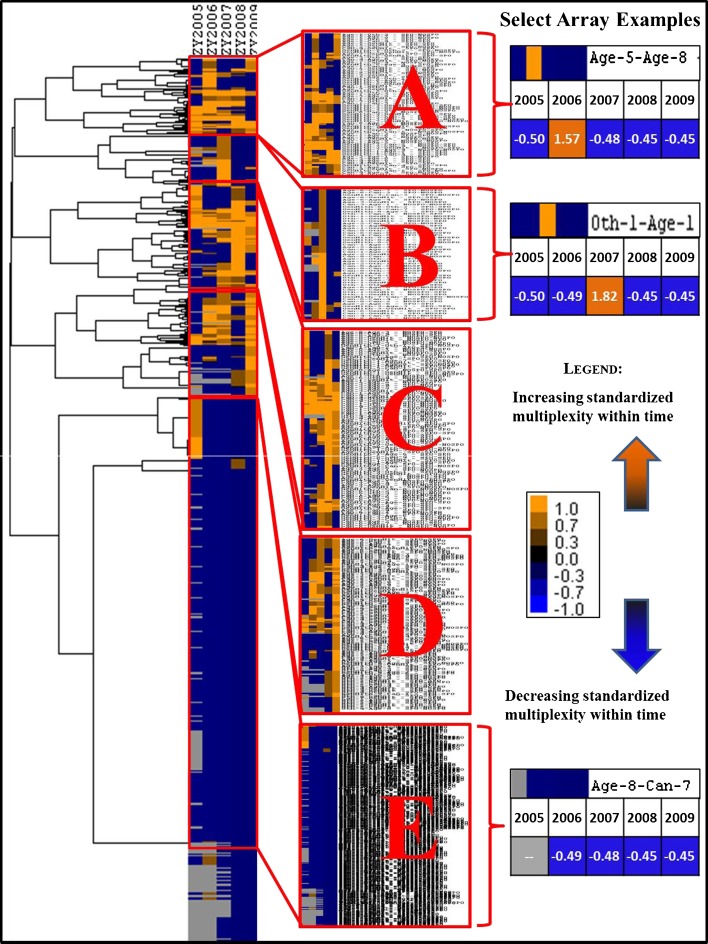
Fig 3.
Cluster analysis heat map illustrating five cluster solutions for activation of relationship multiplexity over time. Gray areas indicate no data for that year. Array examples: rows 1, array heat map/type of reporting partner organization − type of nominated partner organization; 2, years; 3, standardized multiplexity score within year. (Age aging services, Oth other; Can cancer)

