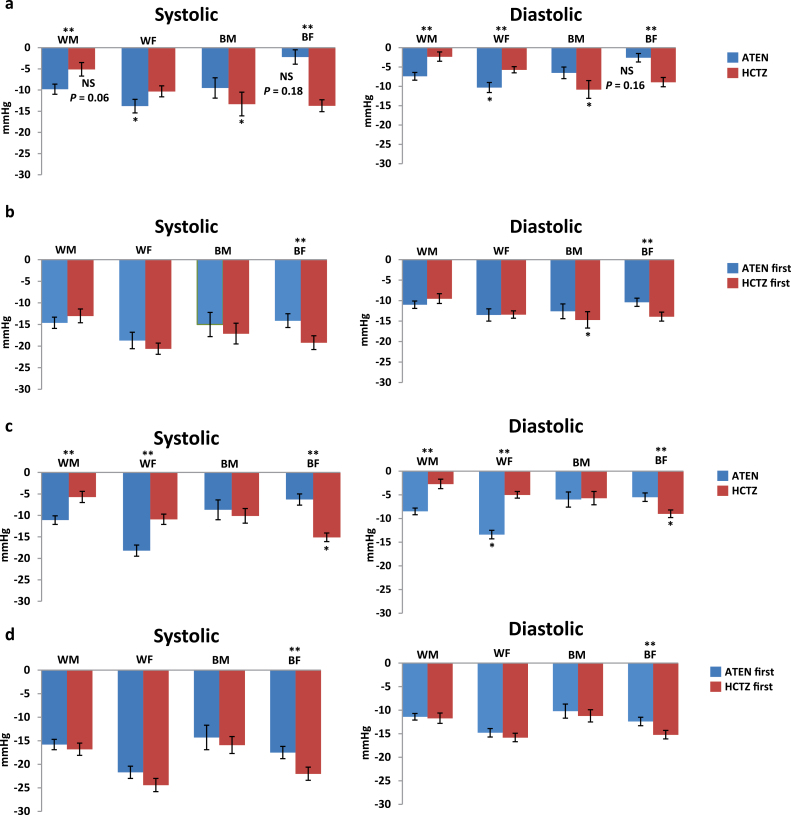
Figure 2.
Systolic and diastolic blood pressure response to atenolol (ATEN) and hydrochlorothiazide (HCTZ) monotherapy and combined therapy in white (W) and black (B) male (M) and female (F) Pharmacogenomic Evaluation of Antihypertensive Responses study participants. (a) Nighttime monotherapy. (b) Nighttime combined therapy. (c) Daytime monotheraphy. (d) Daytime combined therapy. *P <0.05 between whites and blacks. **P < 0.05 between ATEN and HCTZ treatment within a race/sex subgroup. Abbreviation: NS, not significant.

