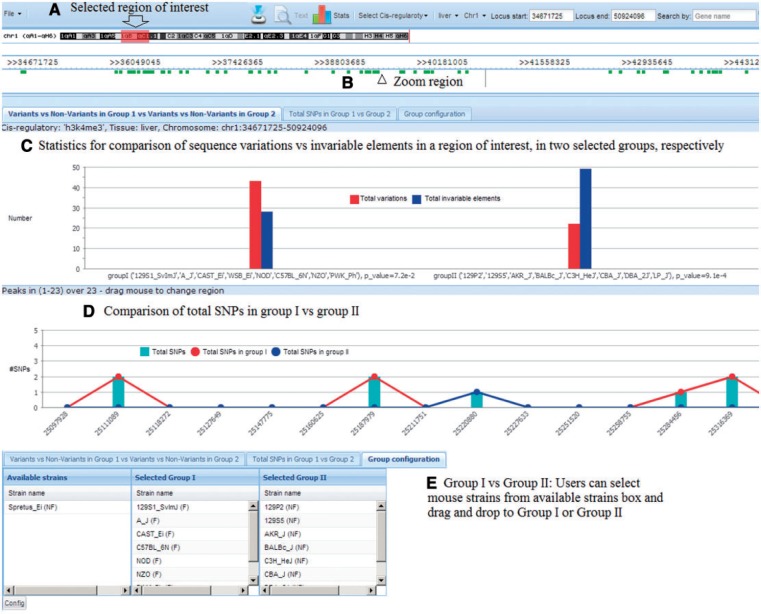
Figure 5.
Tool to identify useful polymorphisms. (A) Users select region of interest; (B) Click ‘View’ to zoom into the region; (C) Statistics show the difference between total variations and nonvariations in each group; (D) Statistics show the total SNPs in each group and (E) Users can select mouse strains for each group.

