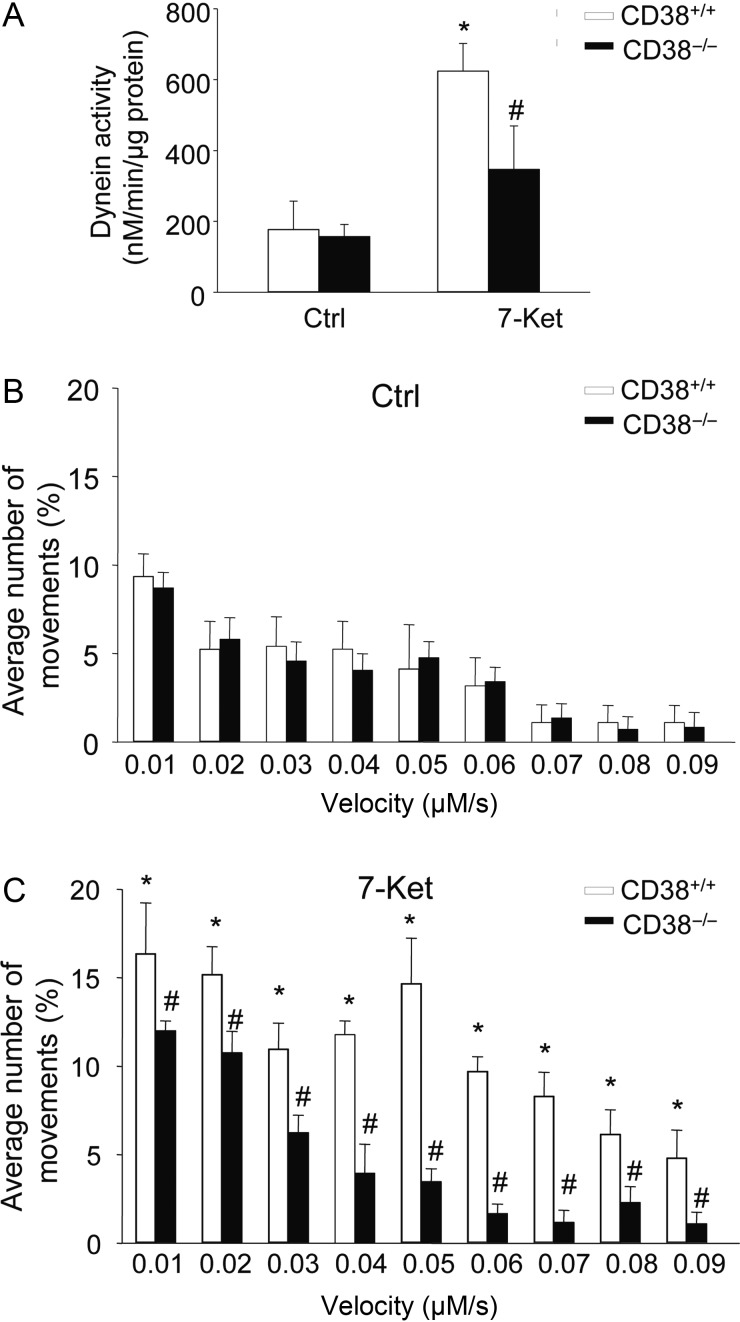
Figure 4.
Dynein activity and autophagosome dynamic movements in CAMs. (A) Summarized data showing the dynein ATPase activity in CD38+/+ and CD38−/− CAMs under control condition or with 7-Ket stimulation. Data are shown means ± SEM of values from four independent experiments. *P < 0.05 vs. control of CD38+/+ CAMs. #P < 0.05 vs. CD38+/+ CAMs with the same treatment by two-way ANOVA with Tukey's post hoc test. (B and C) The summarized data show the velocity of autophagosomes in CD38+/+ and CD38−/− CAMs under control (B) or treated with 7-Ket (C). Data are shown means ± SEM of values from four independent experiments. *P < 0.05 vs. control of CD38+/+ CAMs with the same velocity; #P < 0.05 vs. CD38+/+ CAMs with the same treatment and velocity by two-way ANOVA with Tukey's post hoc test.

