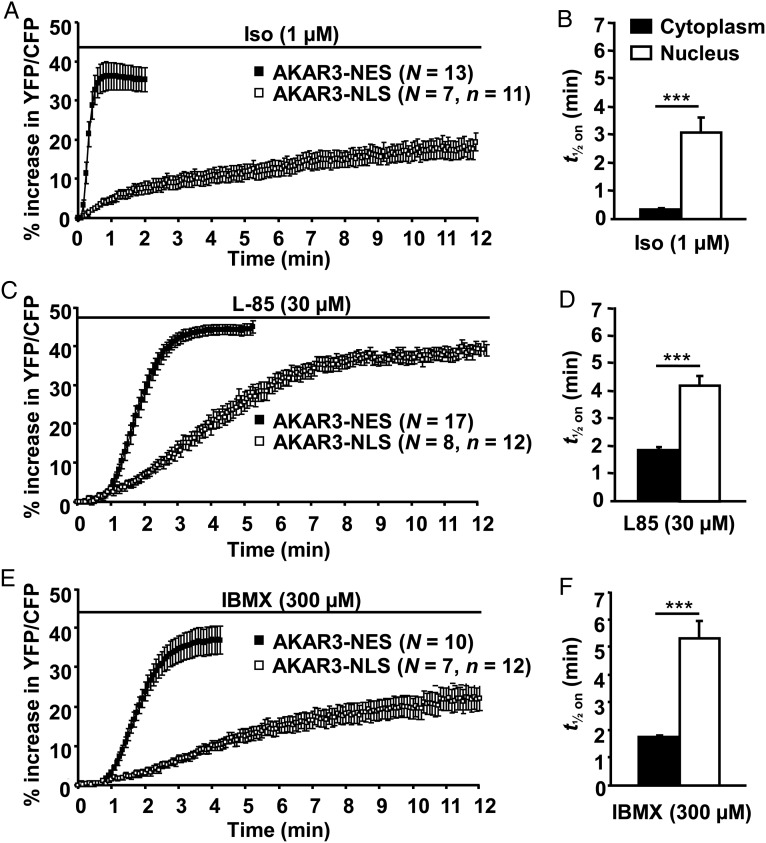
Figure 2.
Comparative kinetics of cytoplasmic and nuclear PKA activation in response to different cAMP-elevating agents in ARVMs. Average time courses of the normalized YFP/CFP ratio obtained from myocytes expressing AKAR3-NES (black squares) and AKAR3-NLS (white squares) upon (A), β-AR stimulation with Iso (1 µM), (C) direct AC activation with L-858051 (L-85, 30 µM), and (E) global PDE inhibition with 3-isobutyl-1-methylxantine (300 µM). N refers to the number of cells, and n refers to the number of nuclei. Each symbol on the graphs represents the mean (±SEM). (B, D, and F) PKA activation kinetics (t1/2 on) obtained from experiments shown in (A, C, and E), respectively. Data are from 10 rats. Statistical significance is indicated as ***P < 0.001.

