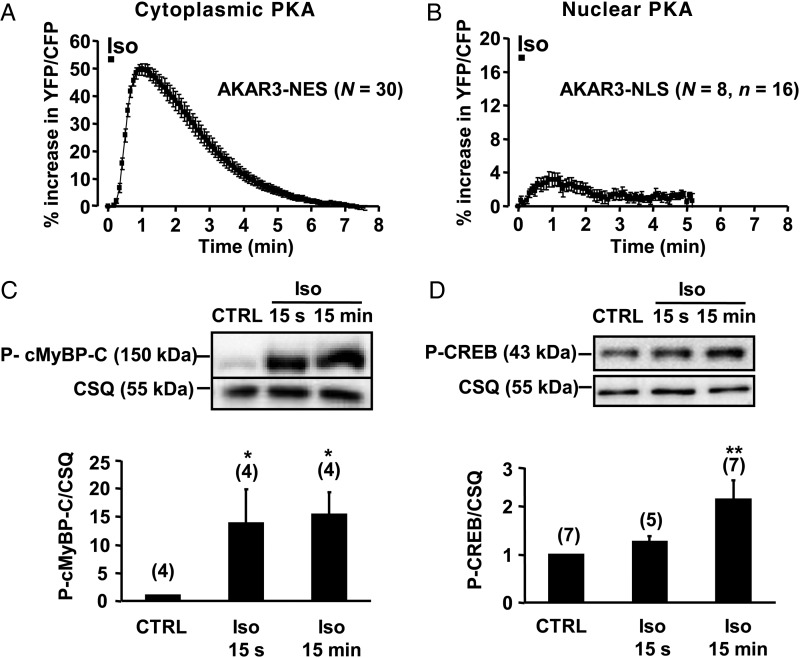
Figure 4.
Comparison of cytoplasmic and nuclear PKA responses upon brief β-AR stimulation in ARVMs. (A and B) Average time course of cytoplasmic and nuclear PKA activities induced by Iso (100 nM, 15 s) in ARVMs expressing AKAR3-NES (A) and AKAR3-NLS (B). Each symbol represents the mean (±SEM). (C and D) Phosphorylation levels of cMyBP-C (C) and CREB (D) in ARVMs treated or not with 100 nM Iso for 15 s or 15 min. Calsequestrin (CSQ) was used as a loading control. Bar graphs represent the mean ± SEM, and the numbers above the bars indicate the number of independent experiments. Data are from 19 rats. Statistical significance between control and Iso conditions is indicated as: *P < 0.05; **P < 0.01.

