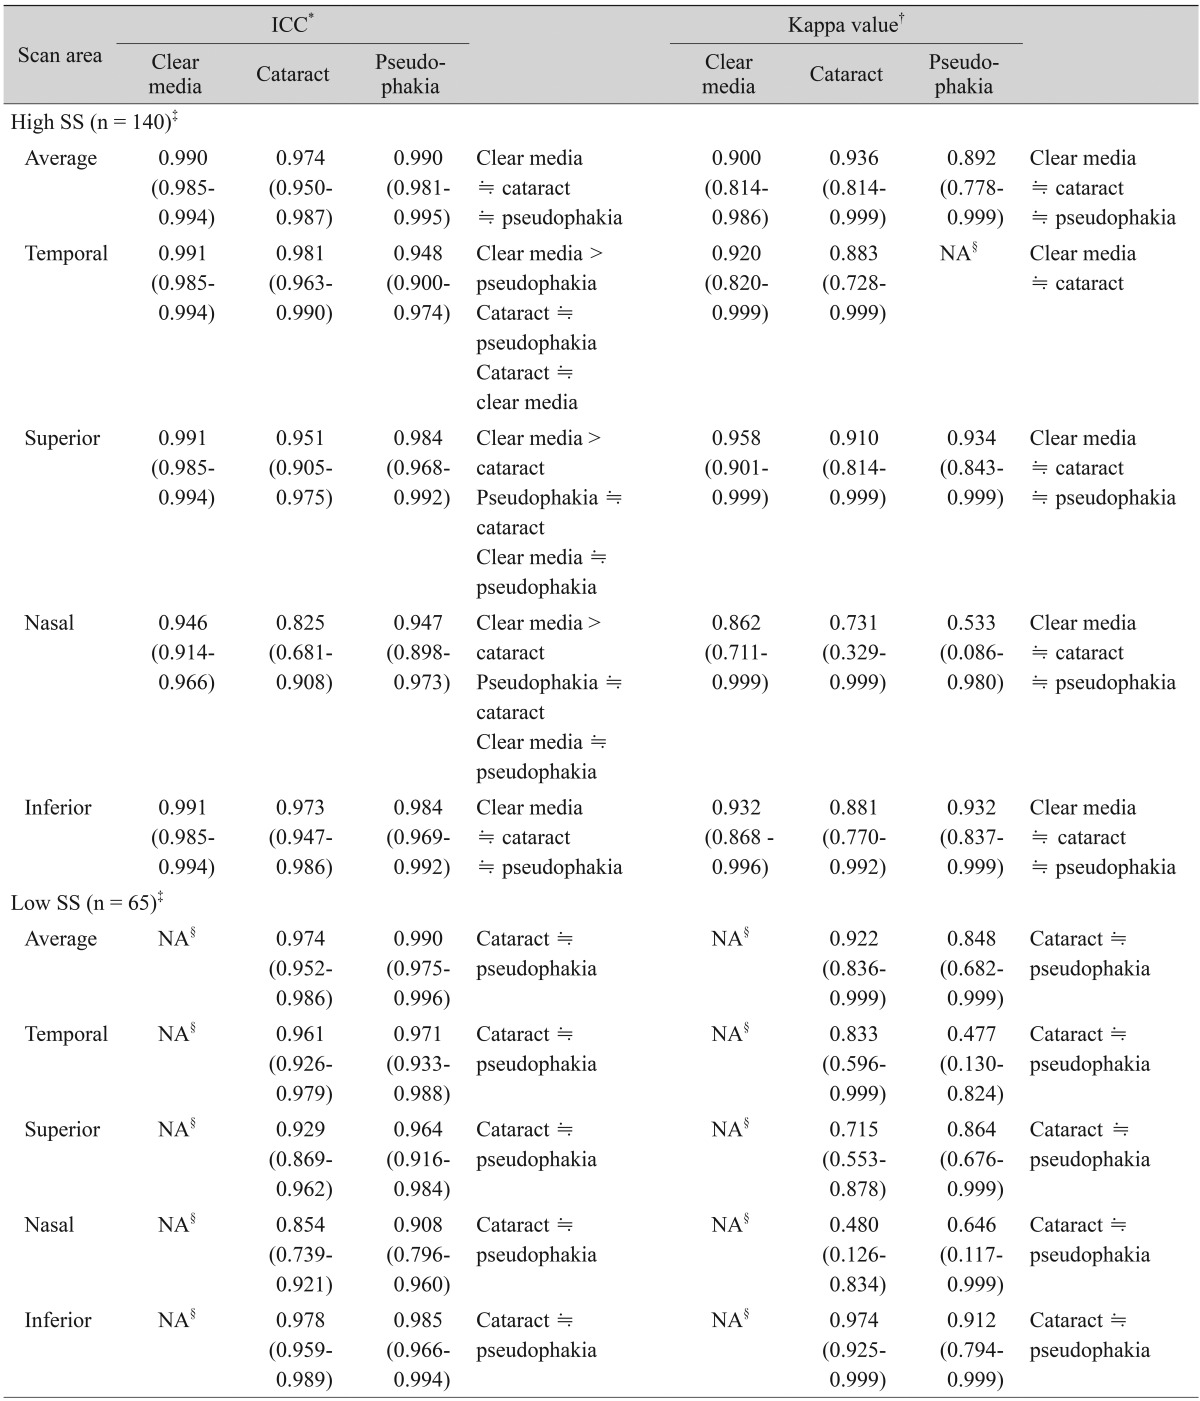
Table 6.
ICC and kappa values in each group classified by signal strength

ICC = intra-class correlation coefficient; NA = not available.
'≒' indicates similar values without statistically significant difference between two groups.
*ICC values with 95% confidence interval in parenthesis, calculated with the two-way random effects model using the absolute agreement definition; †Mean on top with 95% confidence interval in parentheses; ‡High SS (SS ≥5 in two consecutive scans) and low SS (SS <5 in either scan); §Due to insufficient number of categories to perform test.
