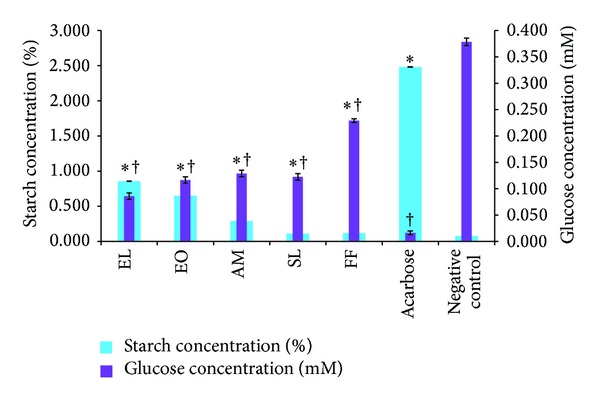
Figure 4.

Percentage starch of reaction mixture and glucose concentration of dialysate in the presence of aqueous extracts. *Values [starch (%) concentration] significantly (P < 0.05) higher than negative control. †Values [glucose (mM) concentration] significantly (P < 0.05) lower than negative control.
