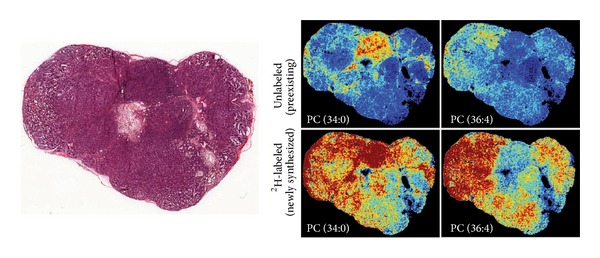
Figure 3.

Correlation of histopathology and mass spectrometry imaging. Serial sections of the tumor are used for histopathology (left) correlation with MSI results (right). Deconvolution of spectra is performed to separate 2H-labeled and unlabeled lipids. Intensity images are generated to show the spatial distribution for both newly synthesized and preexisting lipids. Reprinted with permission from [106]. Copyright 2013 Nature Publishing Group, a division of Macmillan Publishers Limited.
